Siemens industrial automation platform for process control
Learn about WinCC's powerful capabilities for creating industrial strip charts
WinCC (Windows Control Center) by Siemens is a comprehensive SCADA system that provides powerful strip chart capabilities for industrial automation. It offers real-time data visualization with extensive customization options.
Why WinCC is the preferred choice for industrial strip chart applications
Designed specifically for industrial environments with robust architecture, ensuring reliable operation in harsh conditions and 24/7 industrial applications.
Built-in strip chart controls optimized for industrial data visualization with real-time updates, historical playback, and multi-channel display capabilities.
Excellent integration with Siemens automation systems, PLCs, and industrial networks, providing seamless data flow from field devices to strip charts.
Comprehensive data management with built-in historians, archiving capabilities, and database connectivity for long-term data storage and analysis.
Enterprise-grade security features and compliance with industrial standards, ensuring data integrity and system security in critical applications.
Scalable from single-user applications to enterprise-wide deployments, supporting multiple clients and distributed systems across large facilities.
Follow these detailed steps to create industrial strip charts in WinCC
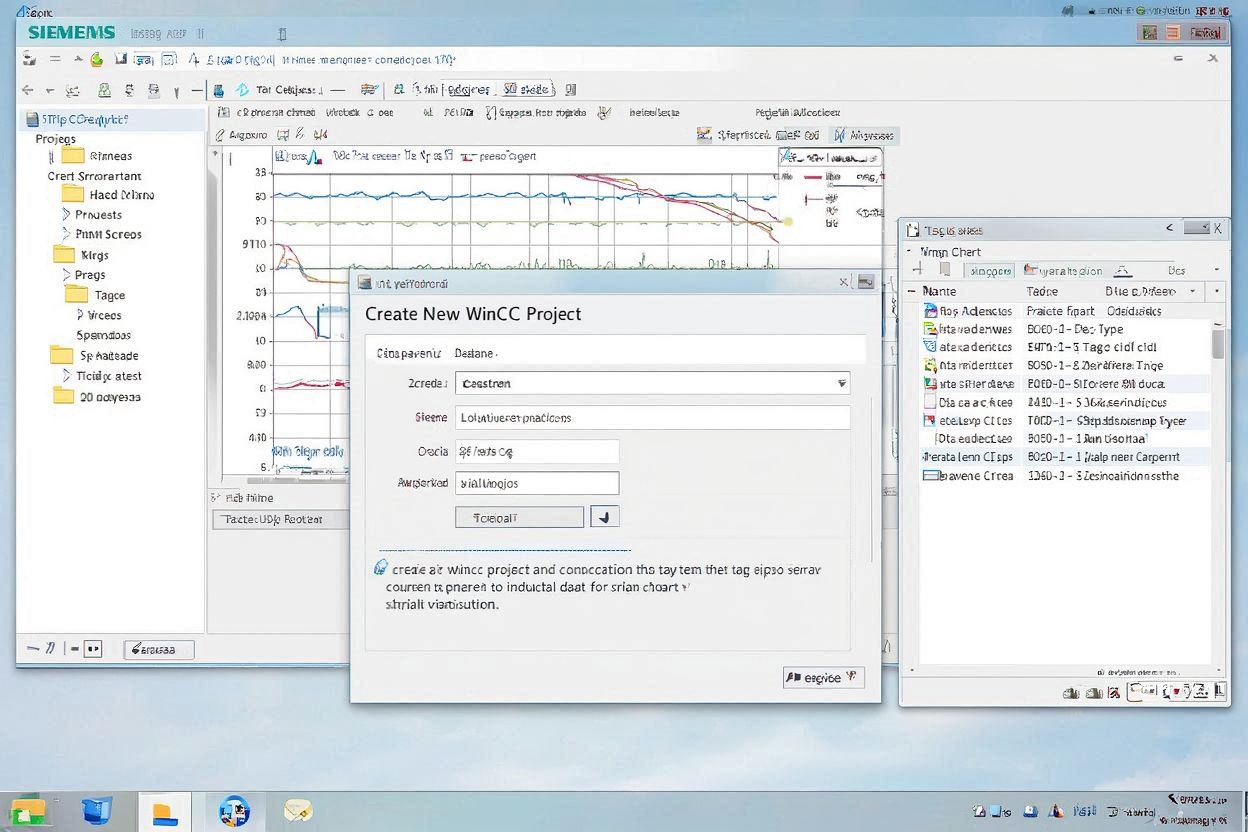
Create a new WinCC project and configure the tag system to connect to your industrial data sources for strip chart visualization.
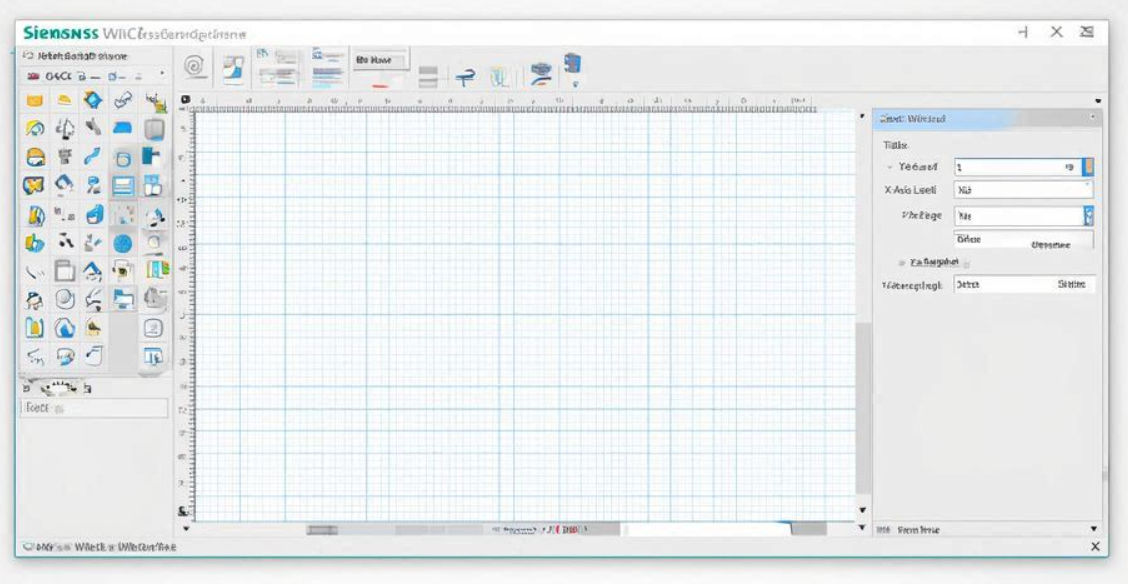
Open the Graphics Designer and create a new picture for your strip chart display, setting up the basic layout and structure.
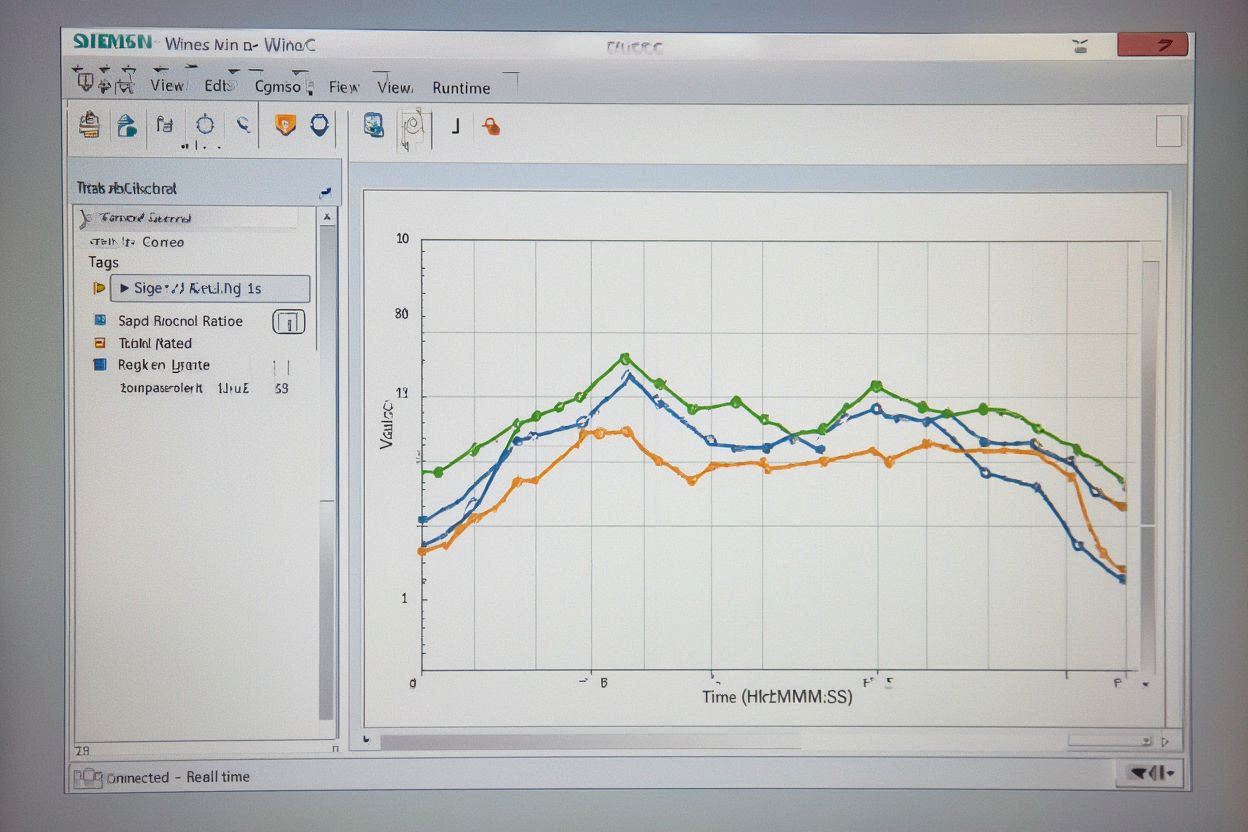
Add a Trend Control object to your picture and configure it for strip chart functionality with real-time data display.
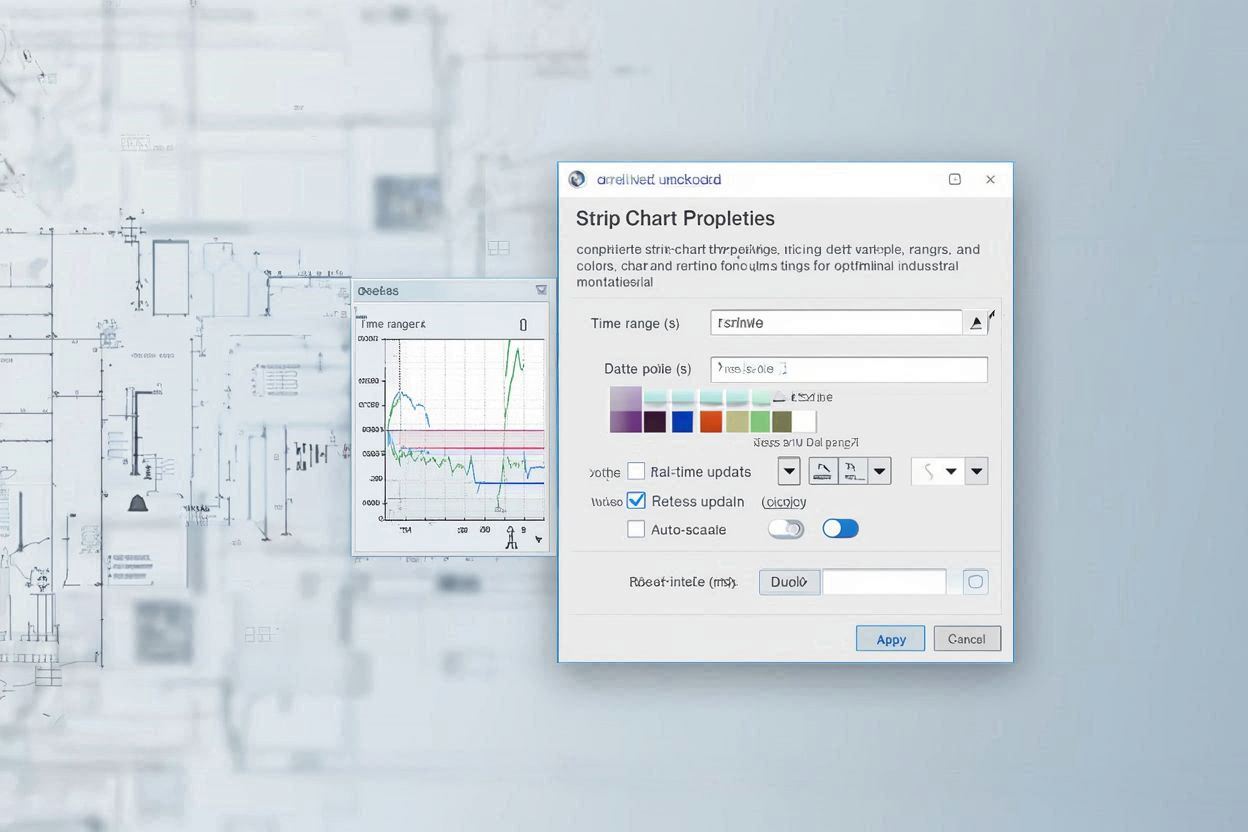
Configure the strip chart properties including time range, data points, colors, and real-time update settings for optimal industrial monitoring.
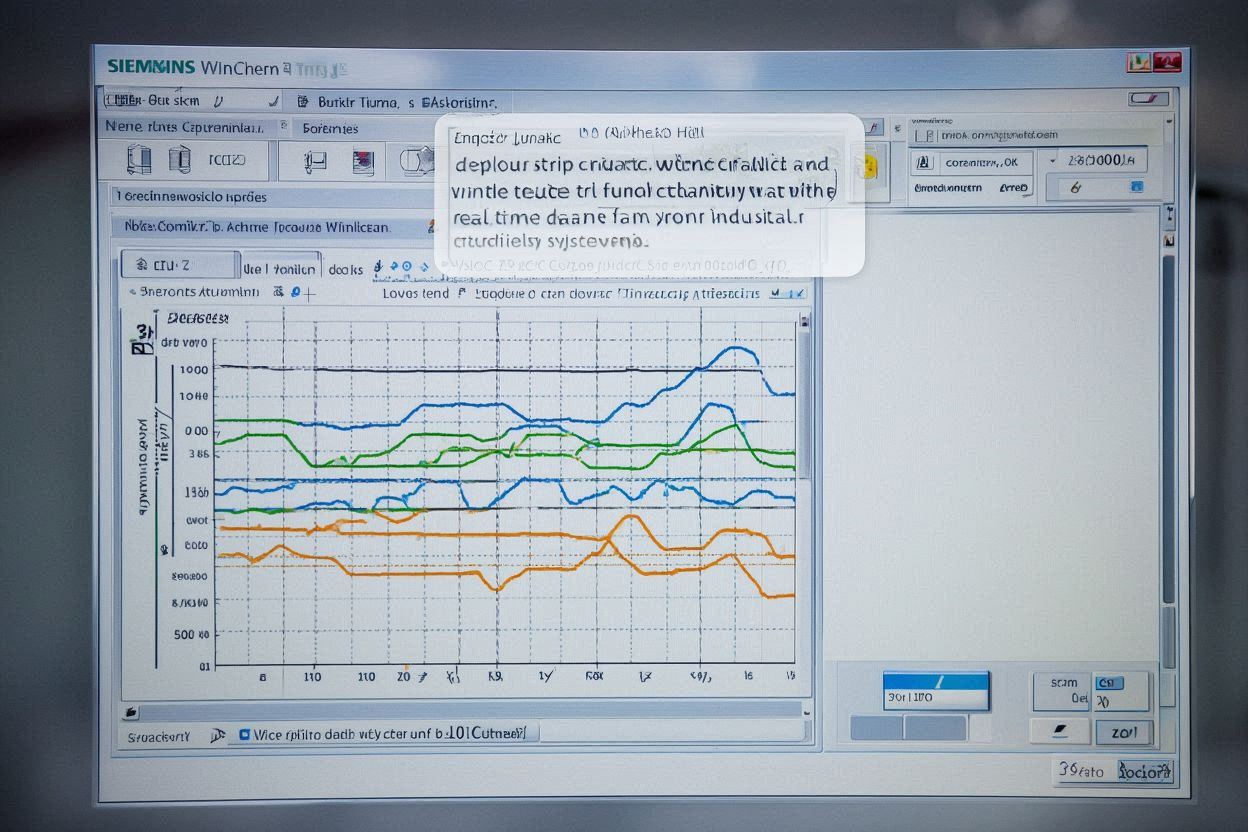
Deploy your strip chart to the WinCC runtime and test its functionality with real-time data from your industrial systems.
Practical configuration examples and real-world applications for WinCC strip charts
// WinCC Strip Chart Configuration
// Object: WinCC Trend Control
// Properties: Strip Chart Mode
// Trend Control Properties:
TrendControl.ChartType = "StripChart";
TrendControl.UpdateMode = "RealTime";
TrendControl.TimeRange = 3600; // 1 hour
TrendControl.MaxPoints = 1000;
// Data Source Configuration
TrendControl.AddTag("Temperature", "DB1.DBD0");
TrendControl.AddTag("Pressure", "DB1.DBD4");
TrendControl.AddTag("Flow", "DB1.DBD8");
// Real-time update
void UpdateStripChart() {
TrendControl.UpdateData();
TrendControl.Refresh();
}
// Tag Configuration
TagConfig = {
"Temperature": {
"Address": "DB1.DBD0",
"DataType": "REAL",
"UpdateRate": 1000
},
"Pressure": {
"Address": "DB1.DBD4",
"DataType": "REAL",
"UpdateRate": 1000
}
};
This basic configuration shows how to set up a simple strip chart in WinCC with real-time data binding and automatic updates from industrial tags.
// Multi-Channel Industrial Strip Chart
// Supporting multiple industrial parameters
// Data Source Configuration:
var dataSources = {
"Temperature": {
"tags": ["Temp_1", "Temp_2", "Temp_3"],
"color": "Red",
"yAxis": "left"
},
"Pressure": {
"tags": ["Press_1", "Press_2", "Press_3"],
"color": "Blue",
"yAxis": "right"
},
"Flow": {
"tags": ["Flow_1", "Flow_2", "Flow_3"],
"color": "Green",
"yAxis": "left"
}
};
// Trend Control Configuration:
TrendControl.ChartType = "StripChart";
TrendControl.UpdateMode = "RealTime";
TrendControl.TimeRange = 7200; // 2 hours
TrendControl.MaxPoints = 2000;
TrendControl.MultipleYAxes = true;
// Real-time update function
function UpdateMultiChannelChart() {
var currentTime = new Date();
for (var channel in dataSources) {
var tags = dataSources[channel].tags;
var values = ReadTags(tags);
TrendControl.AddDataSeries(channel, currentTime, values);
}
TrendControl.Refresh();
}
// Alarm Configuration:
AlarmConfig = {
"highLimit": 100,
"lowLimit": 0,
"alarmEnabled": true,
"notificationMethod": "WinCCAlarm"
};
This advanced configuration demonstrates how to create a multi-channel strip chart with different Y-axes, multiple data sources, and real-time updates for comprehensive industrial monitoring.
// Advanced Strip Chart with Historical Data
// Including data archiving and historical playback
// Historical Data Configuration:
HistoricalConfig = {
"archiveEnabled": true,
"archiveInterval": 1000, // 1 second
"archiveDuration": 86400, // 24 hours
"compressionEnabled": true,
"storageLocation": "WinCCArchive"
};
// Trend Control Advanced Properties:
TrendControl.ChartType = "StripChart";
TrendControl.UpdateMode = "RealTime";
TrendControl.TimeRange = 14400; // 4 hours
TrendControl.MaxPoints = 4000;
TrendControl.HistoricalData = true;
TrendControl.ArchiveAccess = true;
// Data Archiving Function:
void ArchiveStripChartData() {
var currentTime = new Date();
var data = ReadAllTags();
// Archive data
ArchiveManager.StoreData(currentTime, data);
// Update strip chart
TrendControl.AddDataPoint(currentTime, data);
TrendControl.Refresh();
}
// Historical Playback Function:
void PlaybackHistoricalData(startTime, endTime) {
var historicalData = ArchiveManager.RetrieveData(startTime, endTime);
TrendControl.LoadHistoricalData(historicalData);
TrendControl.PlaybackMode = true;
}
// Export Configuration:
ExportConfig = {
"format": "CSV",
"timeRange": "24h",
"dataPoints": "All",
"includeHeaders": true
};
This advanced configuration includes data archiving, historical playback, and export capabilities, demonstrating WinCC's comprehensive industrial data management features.
See how WinCC strip charts are used in actual industrial applications
Manufacturing
Manufacturing facilities use WinCC strip charts to monitor production processes, track equipment performance, and ensure quality control in industrial operations.
Power Generation
Power plants and electrical utilities use WinCC strip charts to monitor electrical parameters, grid stability, and equipment performance in real-time.
Water Treatment
Water treatment facilities and process control systems use WinCC strip charts to monitor treatment processes and ensure water quality standards.