Business data visualization with Excel's powerful charting capabilities
Learn about Excel's capabilities for creating business strip charts
Microsoft Excel is a powerful spreadsheet application that provides basic strip chart capabilities through its line chart functionality. While not as sophisticated as specialized tools, it's accessible and widely used for business applications.
Why Excel is a practical choice for business strip chart applications
Excel is available on virtually every business computer, making strip charts accessible to users without technical expertise or additional software installation.
Most business users are already familiar with Excel, making it easy to create and modify strip charts without extensive training or technical knowledge.
Excel provides seamless integration between data storage, analysis, and visualization, allowing users to work with data and charts in a single environment.
Excel's VBA (Visual Basic for Applications) allows for automation of strip chart creation, real-time updates, and custom functionality for advanced users.
Excel files can be easily shared via email, cloud storage, or collaboration platforms, making strip charts accessible to team members and stakeholders.
Excel is often already available as part of Microsoft Office subscriptions, making it a cost-effective solution for basic strip chart needs.
Follow these detailed steps to create strip charts in Microsoft Excel
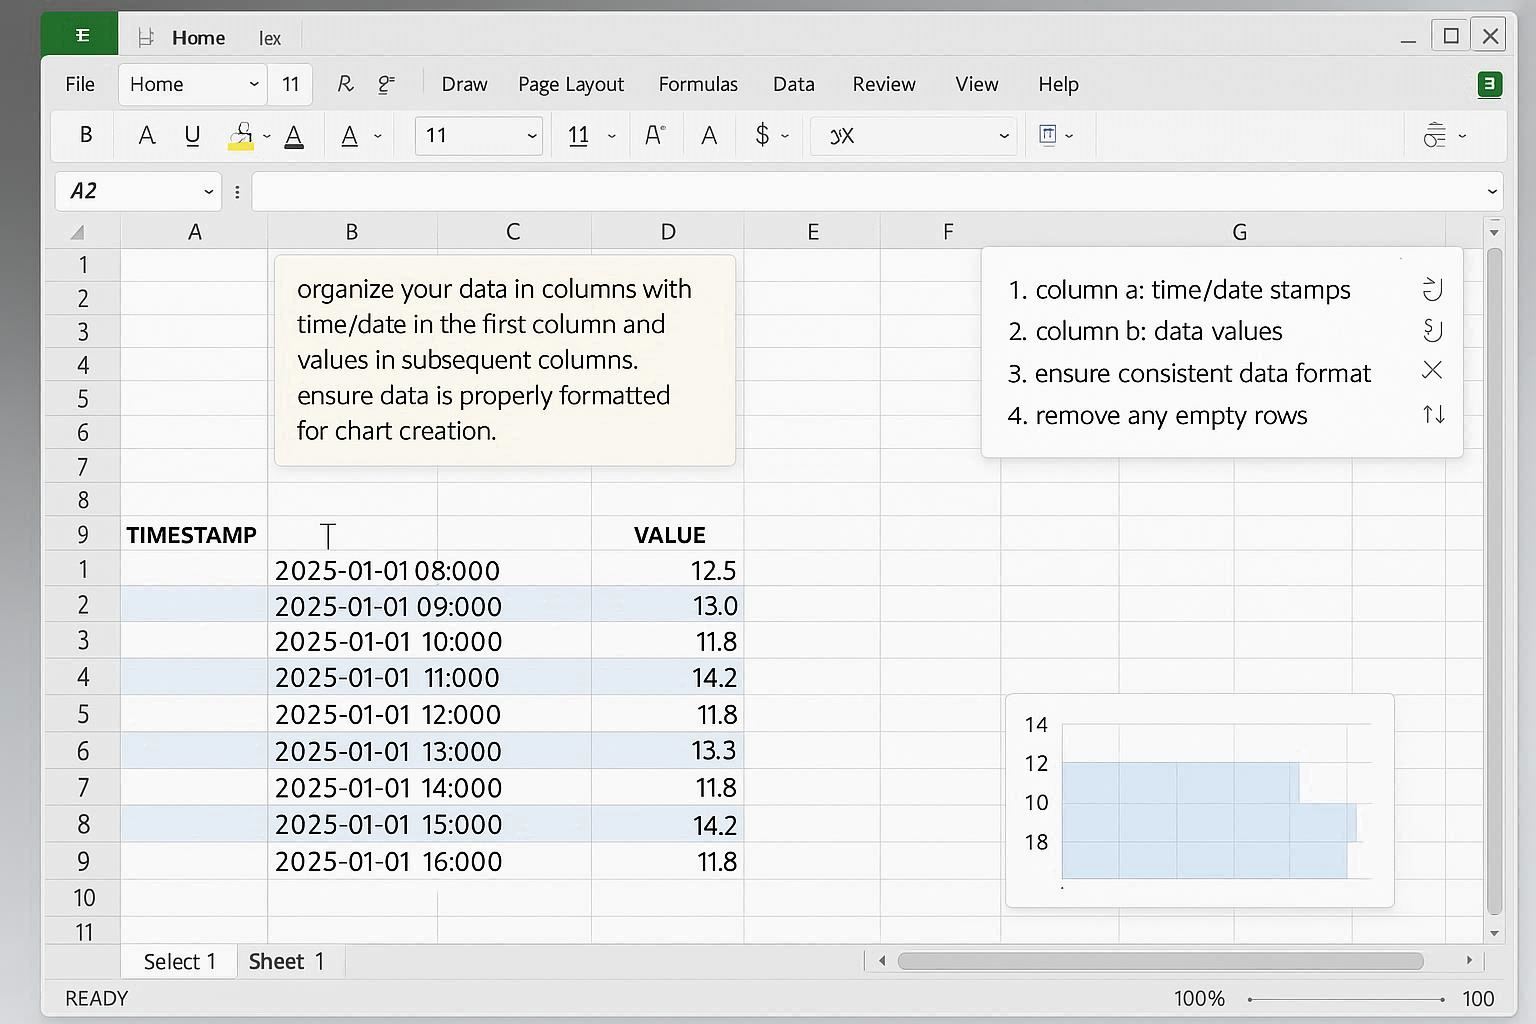
Organize your data in columns with time/date in the first column and values in subsequent columns. Ensure data is properly formatted for chart creation.
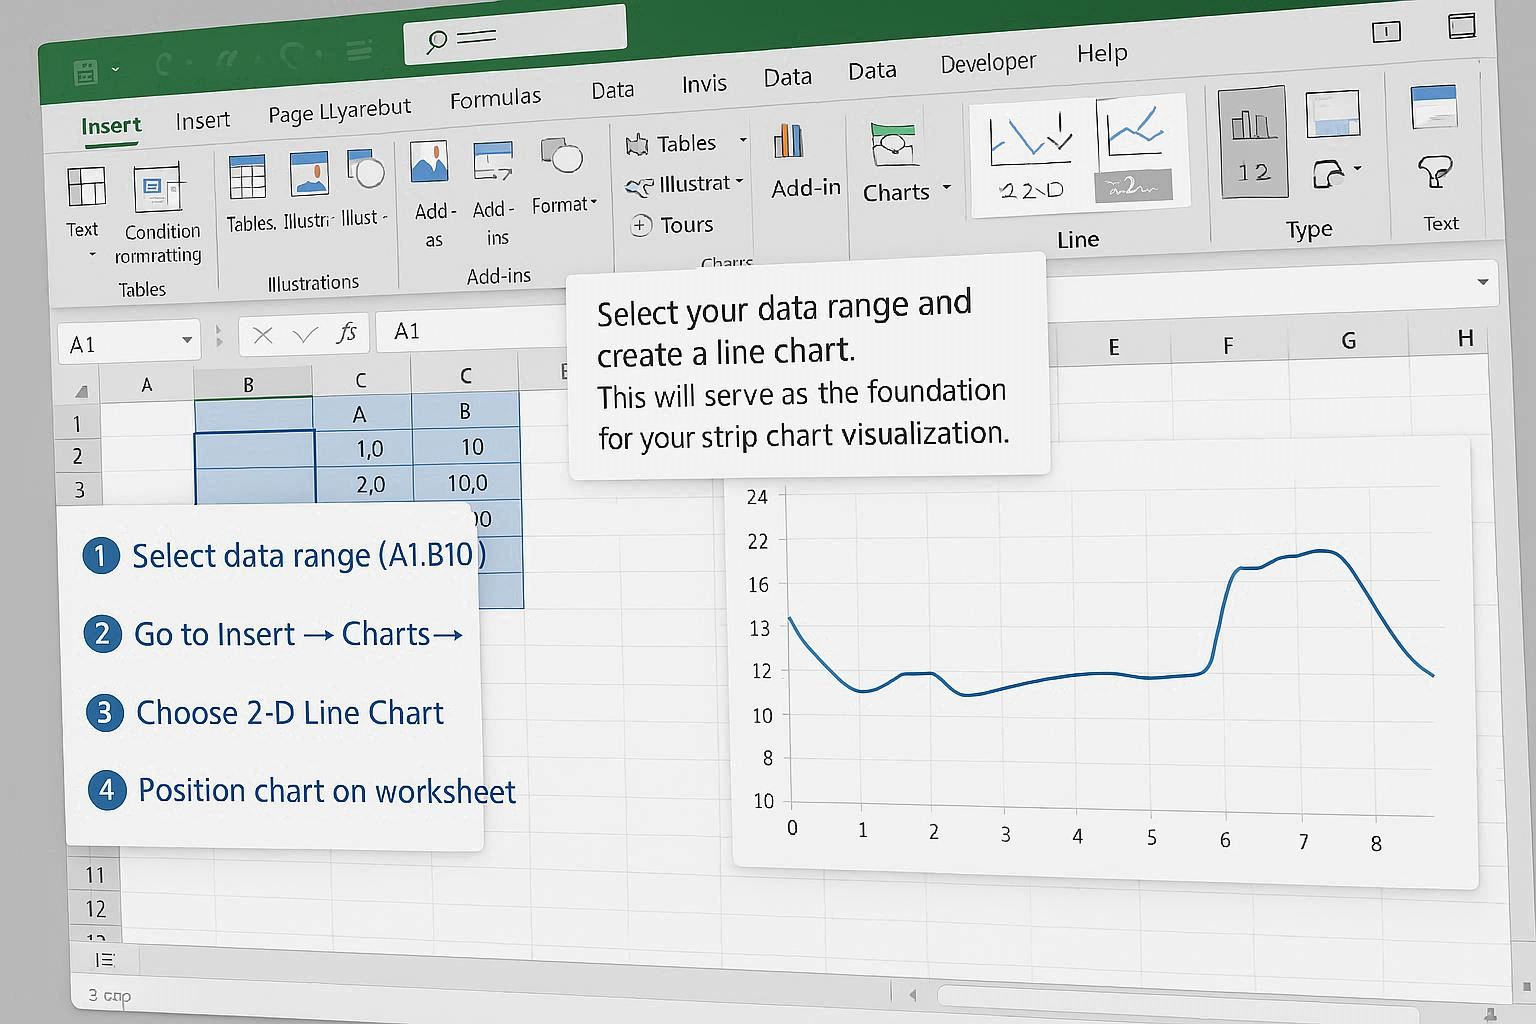
Select your data range and create a line chart. This will serve as the foundation for your strip chart visualization.
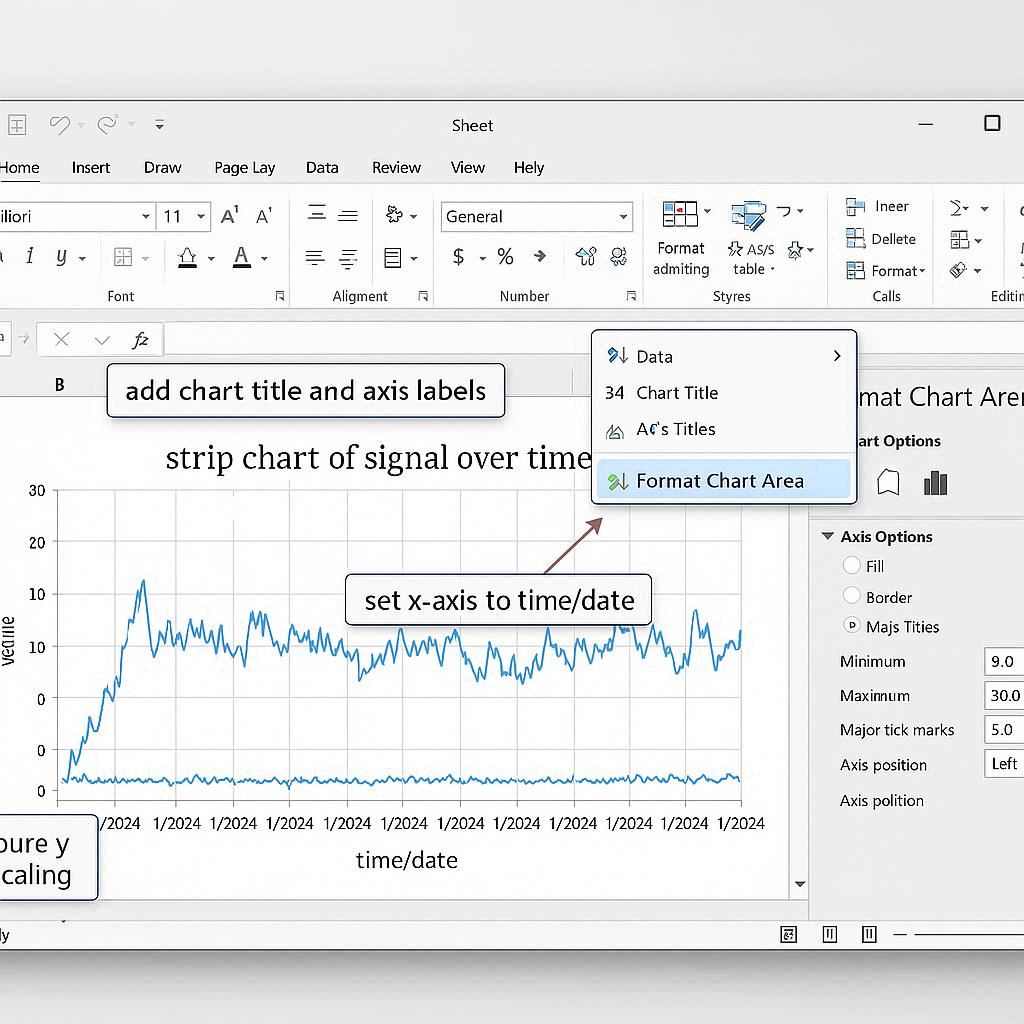
Customize the chart appearance, axes, and formatting to create an effective strip chart display.
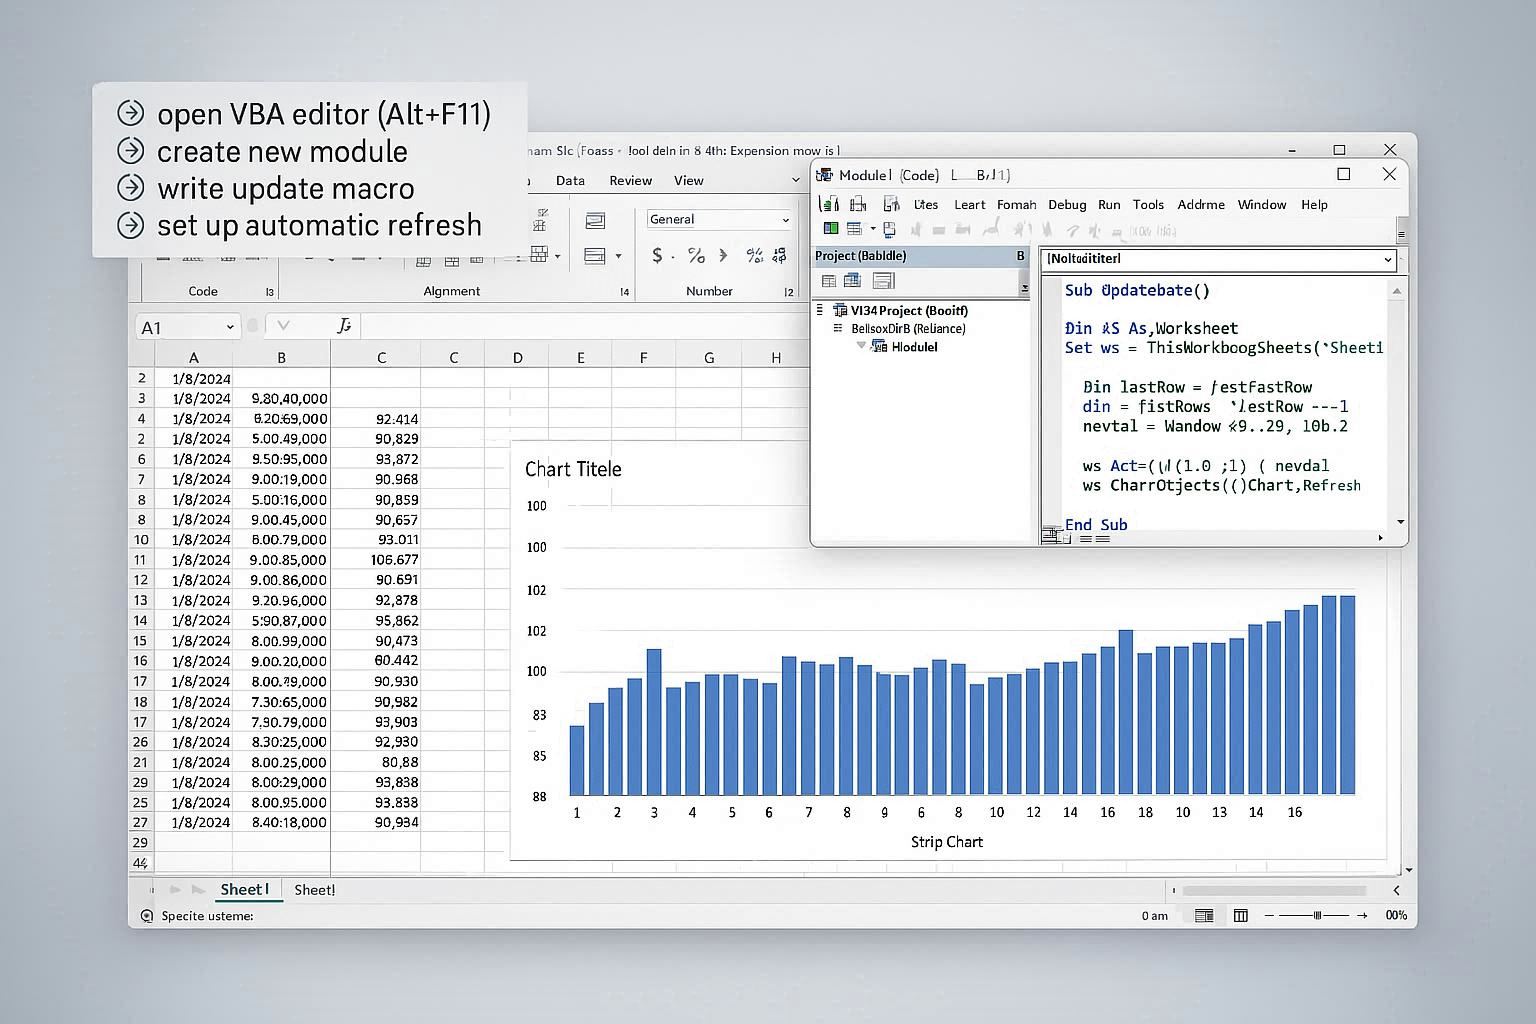
Use VBA to automate data updates and create a dynamic strip chart that refreshes with new data points.
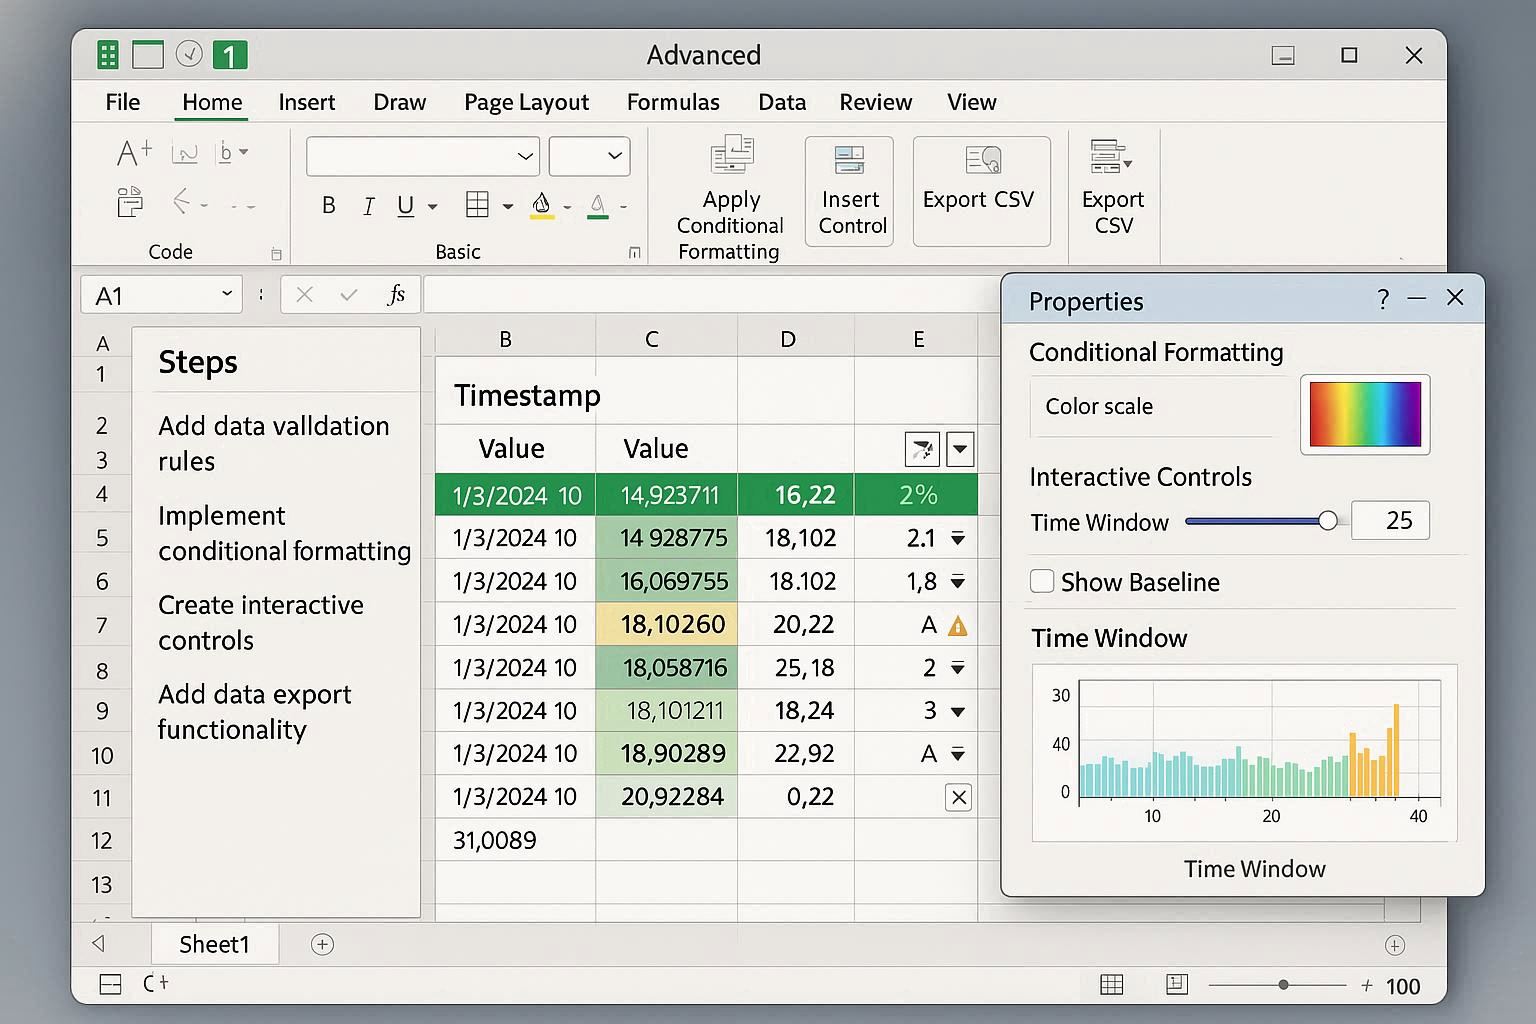
Add advanced features like data validation, conditional formatting, and interactive controls to create a professional strip chart application.
Practical VBA code examples and real-world applications for Excel strip charts
Sub CreateStripChart()
Dim ws As Worksheet
Dim chartObj As ChartObject
Dim chart As Chart
Set ws = ActiveSheet
' Create new chart
Set chartObj = ws.ChartObjects.Add(Left:=100, Top:=100, Width:=600, Height:=400)
Set chart = chartObj.Chart
' Configure chart
With chart
.ChartType = xlLine
.SetSourceData ws.Range("A1:B100")
.HasTitle = True
.ChartTitle.Text = "Real-time Strip Chart"
.Axes(xlCategory).HasTitle = True
.Axes(xlCategory).AxisTitle.Text = "Time"
.Axes(xlValue).HasTitle = True
.Axes(xlValue).AxisTitle.Text = "Value"
End With
' Set up real-time update
Application.OnTime Now + TimeValue("00:00:01"), "UpdateStripChart"
End Sub
Sub UpdateStripChart()
Dim ws As Worksheet
Dim lastRow As Long
Set ws = ActiveSheet
lastRow = ws.Cells(ws.Rows.Count, 1).End(xlUp).Row
' Add new data point
ws.Cells(lastRow + 1, 1).Value = Now()
ws.Cells(lastRow + 1, 2).Value = Rnd() * 100
' Keep only last 100 points
If lastRow > 100 Then
ws.Rows(2).Delete
End If
' Refresh chart
ws.ChartObjects(1).Chart.Refresh
' Schedule next update
Application.OnTime Now + TimeValue("00:00:01"), "UpdateStripChart"
End Sub
This VBA code creates a basic strip chart that automatically updates every second with new data points. The chart maintains a rolling window of the last 100 data points.
Sub CreateMultiChannelStripChart()
Dim ws As Worksheet
Dim chartObj As ChartObject
Dim chart As Chart
Set ws = ActiveSheet
' Create chart
Set chartObj = ws.ChartObjects.Add(Left:=100, Top:=100, Width:=800, Height:=500)
Set chart = chartObj.Chart
' Configure multi-channel chart
With chart
.ChartType = xlLine
.SetSourceData ws.Range("A1:D100")
.HasTitle = True
.ChartTitle.Text = "Multi-Channel Strip Chart"
' Configure series
.SeriesCollection(1).Name = "Temperature"
.SeriesCollection(1).Format.Line.ForeColor.RGB = RGB(255, 0, 0)
.SeriesCollection(2).Name = "Pressure"
.SeriesCollection(2).Format.Line.ForeColor.RGB = RGB(0, 255, 0)
.SeriesCollection(3).Name = "Flow Rate"
.SeriesCollection(3).Format.Line.ForeColor.RGB = RGB(0, 0, 255)
' Add legend
.HasLegend = True
.Legend.Position = xlLegendPositionBottom
End With
End Sub
Sub UpdateMultiChannelData()
Dim ws As Worksheet
Dim lastRow As Long
Set ws = ActiveSheet
lastRow = ws.Cells(ws.Rows.Count, 1).End(xlUp).Row
' Add new data points for all channels
ws.Cells(lastRow + 1, 1).Value = Now()
ws.Cells(lastRow + 1, 2).Value = 20 + Rnd() * 10 ' Temperature
ws.Cells(lastRow + 1, 3).Value = 50 + Rnd() * 20 ' Pressure
ws.Cells(lastRow + 1, 4).Value = 10 + Rnd() * 5 ' Flow Rate
' Keep only last 100 points
If lastRow > 100 Then
ws.Rows(2).Delete
End If
' Refresh chart
ws.ChartObjects(1).Chart.Refresh
End Sub
This example shows how to create a multi-channel strip chart with different colored lines for each data series, perfect for monitoring multiple parameters simultaneously.
Sub CreateAdvancedStripChart()
Dim ws As Worksheet
Dim chartObj As ChartObject
Dim chart As Chart
Dim startBtn As Button
Dim stopBtn As Button
Set ws = ActiveSheet
' Create chart
Set chartObj = ws.ChartObjects.Add(Left:=100, Top:=100, Width:=800, Height:=400)
Set chart = chartObj.Chart
' Configure advanced chart
With chart
.ChartType = xlLine
.SetSourceData ws.Range("A1:B100")
.HasTitle = True
.ChartTitle.Text = "Advanced Strip Chart with Controls"
' Add trend line
.SeriesCollection(1).Trendlines.Add Type:=xlLinear
.SeriesCollection(1).Trendlines(1).Format.Line.ForeColor.RGB = RGB(255, 0, 0)
' Configure axes
.Axes(xlCategory).HasTitle = True
.Axes(xlCategory).AxisTitle.Text = "Time"
.Axes(xlValue).HasTitle = True
.Axes(xlValue).AxisTitle.Text = "Value"
End With
' Add control buttons
Set startBtn = ws.Buttons.Add(100, 50, 80, 30)
startBtn.Caption = "Start"
startBtn.OnAction = "StartDataCollection"
Set stopBtn = ws.Buttons.Add(200, 50, 80, 30)
stopBtn.Caption = "Stop"
stopBtn.OnAction = "StopDataCollection"
End Sub
Sub StartDataCollection()
Application.OnTime Now + TimeValue("00:00:01"), "UpdateStripChart"
End Sub
Sub StopDataCollection()
On Error Resume Next
Application.OnTime Now + TimeValue("00:00:01"), "UpdateStripChart", , False
End Sub
This advanced implementation includes control buttons for starting and stopping data collection, trend lines, and professional chart formatting suitable for business presentations.
See how Excel strip charts are used in actual business applications
Business Analytics
Excel strip charts are commonly used in business environments to monitor key performance indicators, sales trends, and operational metrics in real-time.
Educational Tools
Teachers and students use Excel strip charts for educational purposes, including scientific experiments, data analysis projects, and learning about data visualization.
Personal Finance
Individuals use Excel strip charts to track personal finances, monitor investment performance, and visualize spending patterns over time.