Step-by-Step Guide: Creating Strip Charts in AG Charts
Follow these detailed steps to create enterprise strip charts in AG Charts
1
Install AG Charts Library
Install the AG Charts library in your project using npm or include it via CDN, then set up the basic project structure.
- Install via npm:
npm install ag-charts-community - Or include via CDN
- Set up project structure
- Configure build tools
2
Create HTML Container
Create an HTML container element for your strip chart and set up the basic HTML structure with proper styling.
- Create HTML container div
- Set container dimensions
- Add CSS styling
- Configure responsive design
3
Initialize AG Charts Instance
Initialize the AG Charts instance with basic configuration for strip chart functionality and real-time data updates.
- Import AG Charts library
- Create chart instance
- Configure basic options
- Set up data binding
4
Configure Strip Chart Properties
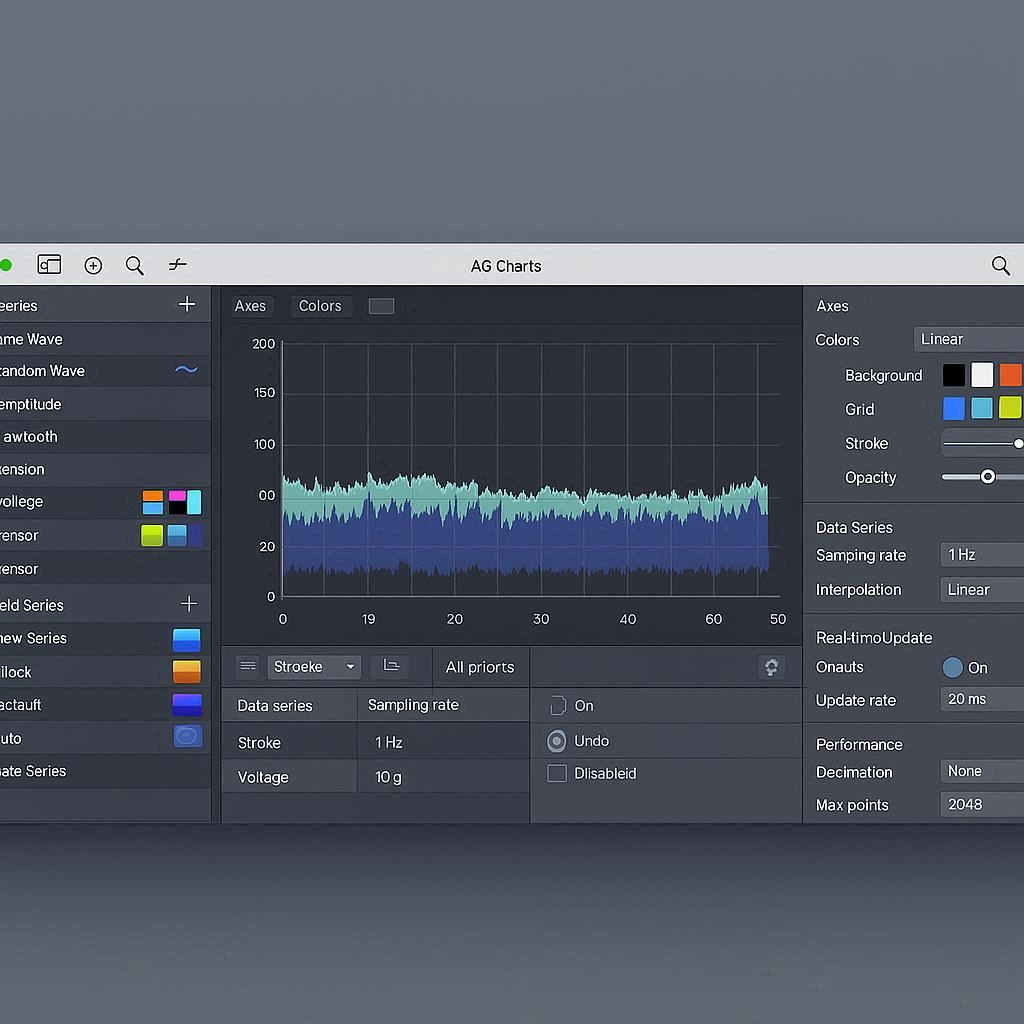
Configure the strip chart properties including data series, axes, colors, and real-time update settings for optimal performance.
- Configure data series
- Set up axes and scaling
- Configure colors and styling
- Set up real-time updates
5
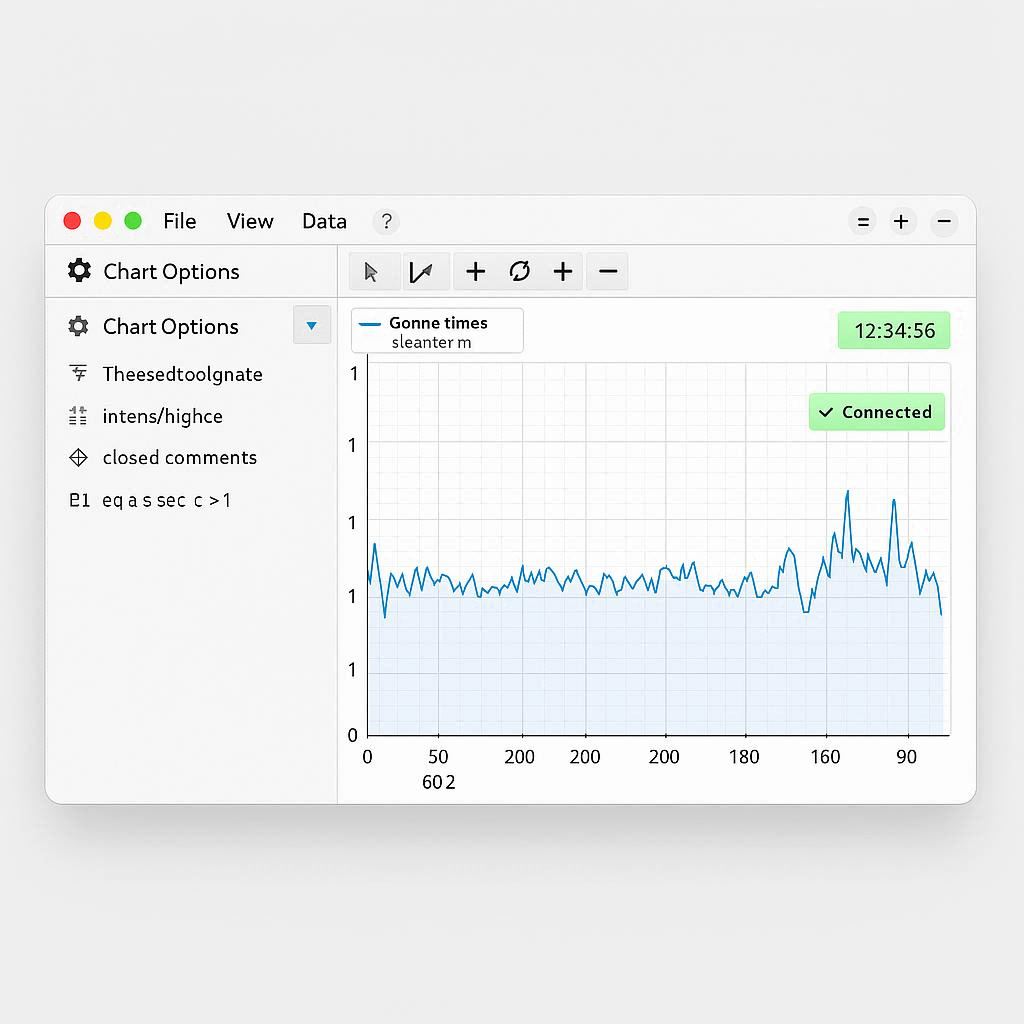
Implement Real-time Data Updates
Implement real-time data updates using WebSocket connections, AJAX requests, or other data sources for live strip chart visualization.
- Set up data source connections
- Implement update mechanisms
- Handle data buffering
- Add error handling