Pool Test Strip Chart
Professional swimming pool water quality monitoring with real-time strip chart visualization
Professional swimming pool water quality monitoring with real-time strip chart visualization
Comprehensive Pool Test Strip Chart monitoring for swimming pool water quality analysis
Pool Test Strip Charts are essential tools for monitoring swimming pool water quality in real-time. They provide continuous visualization of critical water parameters to ensure safe, clean, and properly balanced pool water.
Advanced strip chart technology provides comprehensive monitoring capabilities with professional-grade accuracy and reliability.
Critical Pool Test Strip Chart parameters for comprehensive swimming pool water quality analysis
Real-time Pool Test Strip Chart examples and comprehensive interpretation guide
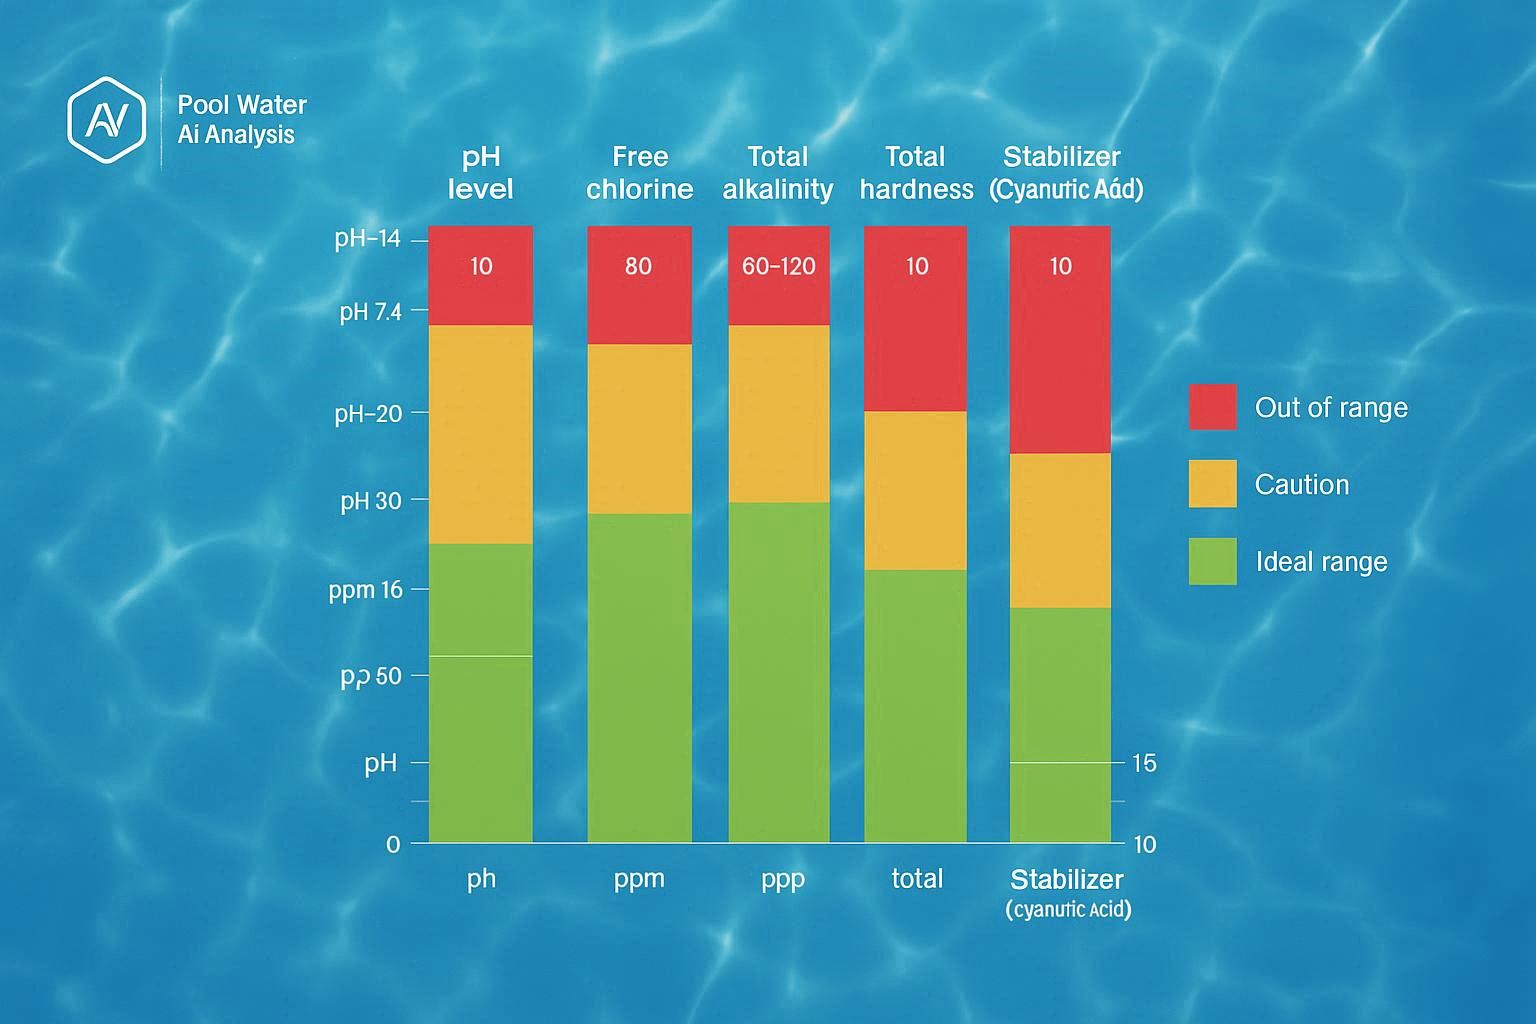
All parameters stay within their normal ranges. Lines should be relatively stable with minor fluctuations.
Parameters approaching or exceeding normal limits. Immediate attention may be required.
Parameters outside safe ranges. Immediate corrective action required to prevent equipment damage and health risks.
Understanding traditional paper test strips and how they compare to modern Pool Test Strip Charts
Complete Pool Test Strip Chart troubleshooting when water quality parameters are out of range
The most critical – affects chlorine effectiveness and swimmer comfort
Ideal Range: 7.2–7.8 (Optimal 7.4–7.6)
| pH Reading | Adjustment Direction | Chemical to Use | Dosage (per 1000 liters of water) | Key Points |
|---|---|---|---|---|
| <7.2 (Too Acidic) | Raise pH | Sodium Carbonate (Soda Ash, Na₂CO₃) or Sodium Bicarbonate (Baking Soda, NaHCO₃) |
Soda Ash: 5-8g (raises pH by 0.1-0.2) Baking Soda: 10-15g (raises pH by 0.1-0.2) |
1. Baking soda raises pH gently and also slightly increases total alkalinity; ideal for slightly low pH (7.0-7.2). 2. Soda ash raises pH more significantly; suitable for low pH (<7.0). 3. Always pre-dissolve the chemical in a small amount of water before evenly pouring it around the pool edge with the circulation pump running. |
| >7.8 (Too Alkaline) | Lower pH | Sodium Bisulfate (pH Decreaser, NaHSO₄) or Hydrochloric Acid (HCl, ~30% concentration) |
Sodium Bisulfate: 8-12g (lowers pH by 0.1-0.2) Hydrochloric Acid: 3-5ml (lowers pH by 0.1-0.2) |
1. Sodium bisulfate is safer and recommended for beginners. Hydrochloric acid is corrosive—wear gloves/goggles and pour slowly along the pool wall to avoid splashing. 2. Never mix with chlorine-based chemicals (can produce toxic gas). 3. Run the circulation pump and apply the chemical in different areas of the pool to prevent localized over-acidification. |
Essential for sanitizing and preventing bacteria/algae
Ideal Range: 1–3 ppm (parts per million)
| Free Chlorine Reading | Adjustment Direction | Chemical to Use | Dosage (per 1000 liters of water) | Key Points |
|---|---|---|---|---|
| <1 ppm (Too Low) | Raise Chlorine |
Sodium Hypochlorite (Liquid Chlorine, 10-12%) Trichlor (Chlorine Tablets/Granules) Calcium Hypochlorite (Shock Powder, ~65% chlorine) |
Liquid Chlorine: 10-15 ml (raises ~1 ppm) Chlorine Tablet: 1 tablet (~20g, raises 1-1.5 ppm) Shock Powder: 3-5g (raises ~1 ppm) |
1. Liquid Chlorine: Pour evenly around the pool edge with the pump running. Avoid direct contact with the pool floor to prevent damage. 2. Chlorine Tablets: Always use a chlorinator or floater for slow dissolution. Never throw directly into the pool. 3. After adding chlorine, wait 2-4 hours with the pool closed and pump running before retesting and allowing swimmers back in (until FC is 1-3 ppm). |
| >5 ppm (Too High) | Lower Chlorine |
1. Natural Aeration (run pump, remove cover) 2. Sodium Thiosulfate (Chlorine Neutralizer) |
Neutralizer: 1-2g (lowers ~1 ppm) |
1. Natural aeration is the preferred method (safe, cost-free). It typically takes 12-24 hours to lower levels into a safe range. 2. Use a chlorine neutralizer only if a rapid reduction is needed. Dissolve completely before adding, circulate water well, and retest after 1 hour. |
Acts as a pH buffer to prevent rapid fluctuations
Ideal Range: 80–120 ppm
| Total Alkalinity Reading | Adjustment Direction | Chemical to Use | Dosage (per 1000 liters of water) | Key Points |
|---|---|---|---|---|
| <80 ppm (Too Low) | Raise Alkalinity | Sodium Bicarbonate (Baking Soda, NaHCO₃) | 15-20g (raises by ~10 ppm) |
1. Baking soda is the preferred chemical for raising alkalinity as it is gentle and has a minimal immediate impact on pH. 2. Pre-dissolve and broadcast evenly around the pool with the circulation pump running. Retest after 2-4 hours. 3. If alkalinity is very low (<60 ppm), split the dose into two applications 4 hours apart to avoid overshooting the target. |
| >150 ppm (Too High) | Lower Alkalinity | Sodium Bisulfate (pH Decreaser) or Hydrochloric Acid (Muriatic Acid) |
pH Decreaser: 15-20g (lowers by ~10 ppm) Muriatic Acid: 5-8ml (lowers by ~10 ppm) |
1. The method is the same as for lowering pH, but larger quantities are typically required. 2. This process will also lower pH significantly. Monitor pH closely. If pH drops below 7.2, stop and adjust pH back up before continuing to lower alkalinity. 3. For very high levels, partial drainage (10-20%) and refilling with fresh water (which usually has lower alkalinity) may be the most practical solution. |
Professional tools and software for creating advanced Pool Test Strip Charts
Create dynamic pool test strip charts using matplotlib, plotly, or bokeh libraries.
Interactive web-based strip charts using Chart.js, D3.js, or custom Canvas implementations.
Industrial-grade strip chart creation for automated pool monitoring systems.
Simple strip chart creation using Excel's charting capabilities for basic monitoring.
AI-powered strip chart systems use machine learning and artificial intelligence to automatically analyze pool water quality data, predict trends, and provide intelligent recommendations.
AI system strip charts integrate artificial intelligence with real-time pool monitoring to automatically interpret water quality data, identify patterns, predict potential issues, and recommend optimal chemical adjustments. These systems learn from historical data to improve accuracy over time.
Step-by-step Pool Test Strip Chart usage guide for effective swimming pool water monitoring
Configure your strip chart system with appropriate sensors and data collection intervals.
Regularly check strip chart readings and respond to any parameter deviations.
Analyze weekly trends to identify patterns and optimize pool maintenance.
Take corrective action based on strip chart readings and parameter analysis.