Chlorine Test Color Chart
Free/Total/Combined Chlorine interpretation with real-time strip chart visualization
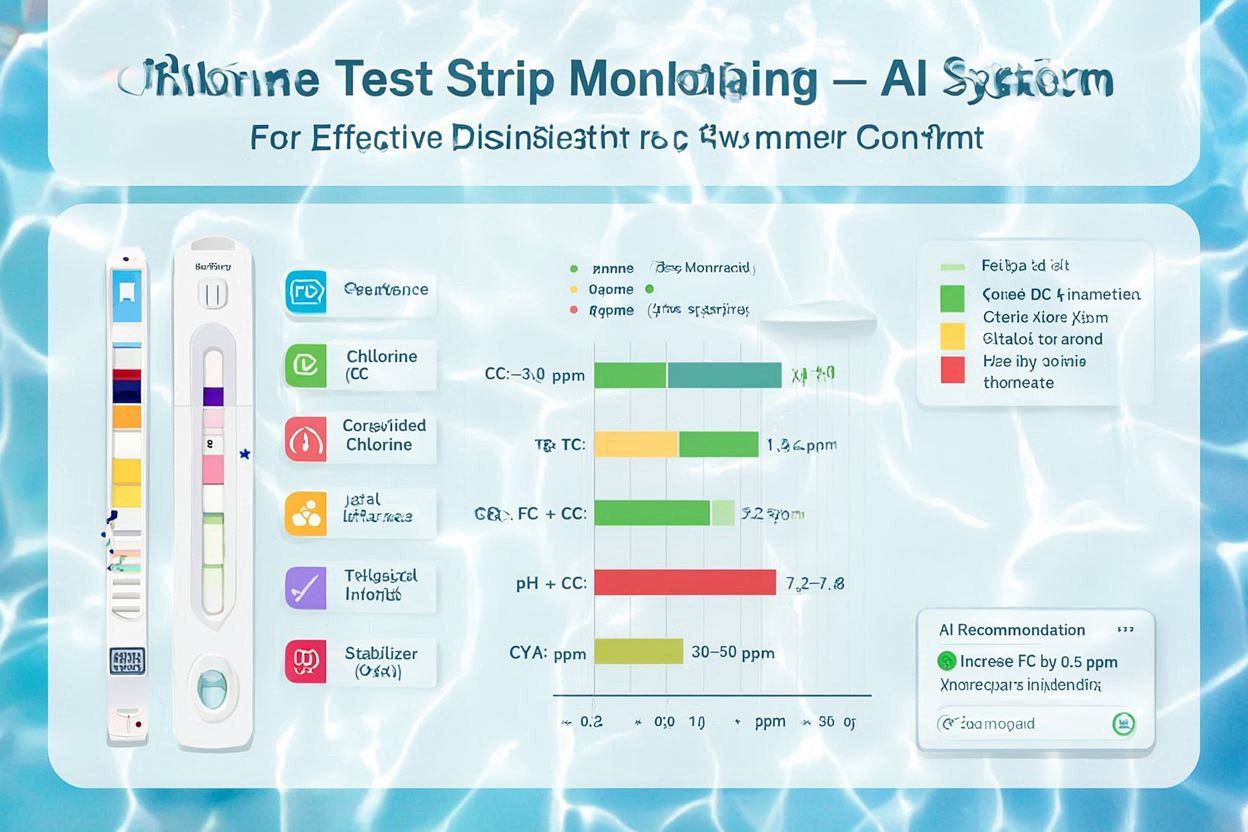
Free/Total/Combined Chlorine interpretation with real-time strip chart visualization
Understand and monitor chlorine-related parameters for effective disinfection and swimmer comfort
Free Chlorine (FC) sanitizes water. Combined Chlorine (CC) indicates chloramines that cause odor and irritation. Total Chlorine (TC) = FC + CC. Maintain proper levels for safety and clarity.
Color charts provide quick visual correlation between strip pad color and chlorine concentration ranges. Real-time strip charts add history, trend, and alerting for proactive control.
Key chlorine parameters and recommended ranges for pools and spas
Real-time example with Free/Total/Combined Chlorine visualization and interpretation
FC within 1-4 ppm, CC ≤ 0.2 ppm, TC ≈ FC. Water is properly sanitized and comfortable.
TC noticeably greater than FC. Plan breakpoint chlorination (shock) to clear chloramines.
FC below 1 ppm risks algae and pathogens. Raise FC immediately; verify pH and CYA.
Compare paper color charts with modern, real-time digital strip charts
Common chlorine issues and corrective actions
Create digital chlorine charts with professional tools
Build chlorine trend charts using matplotlib/plotly with automated alerts.
Interactive web charts on Canvas or D3 for chlorine management dashboards.
Industrial SCADA-style chlorine monitoring with logging and alarms.
Simple chlorine data tracking with conditional formatting alert rules.
AI-powered tools for Chlorine Strip Chart analysis and optimization.
Step-by-step usage for accurate chlorine testing and control
Collect fresh water sample away from returns; follow strip timing precisely.
Use the color chart and digital strip chart trends to assess chlorine balance.
Adjust dosing based on FC/CC status; verify results after circulation.
Maintain routine checks and leverage alerts for stable chlorine levels.