LabVIEW Strip Chart

Professional industrial data visualization with LabVIEW's powerful strip chart capabilities

Real-time Data
Industrial Grade
Data Logging

LabVIEW Introduction

Learn about LabVIEW's powerful capabilities for creating professional strip charts

What is LabVIEW?

LabVIEW (Laboratory Virtual Instrument Engineering Workbench) is a graphical programming environment developed by National Instruments. It's the industry standard for creating virtual instruments and industrial automation applications.

Key Features

  • Graphical programming with drag-and-drop interface
  • Native strip chart mode in Waveform Chart control
  • Real-time data acquisition and visualization
  • Hardware integration with DAQ devices
  • Multi-channel data display capabilities
  • Extensive library of analysis functions

Main Applications

  • Industrial process monitoring
  • SCADA systems development
  • Test and measurement applications
  • Research and development projects
  • Quality control systems
  • Data acquisition systems

Advantages of Using LabVIEW for Strip Charts

Why LabVIEW is the preferred choice for industrial strip chart applications

Real-time Performance

LabVIEW provides native real-time capabilities with deterministic execution, ensuring consistent data acquisition and visualization performance for critical industrial applications.

Hardware Integration

Seamless integration with National Instruments DAQ devices, sensors, and industrial hardware through built-in drivers and communication protocols.

Industrial Reliability

Designed for industrial environments with robust error handling, data validation, and system monitoring capabilities for 24/7 operation.

Native Strip Chart Mode

Built-in Waveform Chart control with native "Strip Chart" mode provides optimized performance for continuous data streaming and visualization.

Graphical Programming

Intuitive drag-and-drop interface makes it accessible to engineers without extensive programming experience, reducing development time.

Data Management

Comprehensive data logging, storage, and analysis capabilities with built-in database connectivity and file I/O operations.

Step-by-Step Guide: Creating Strip Charts in LabVIEW

Follow these detailed steps to create professional strip charts in LabVIEW

1

Create New VI and Add Waveform Chart

LabVIEW Front Panel with Waveform Chart

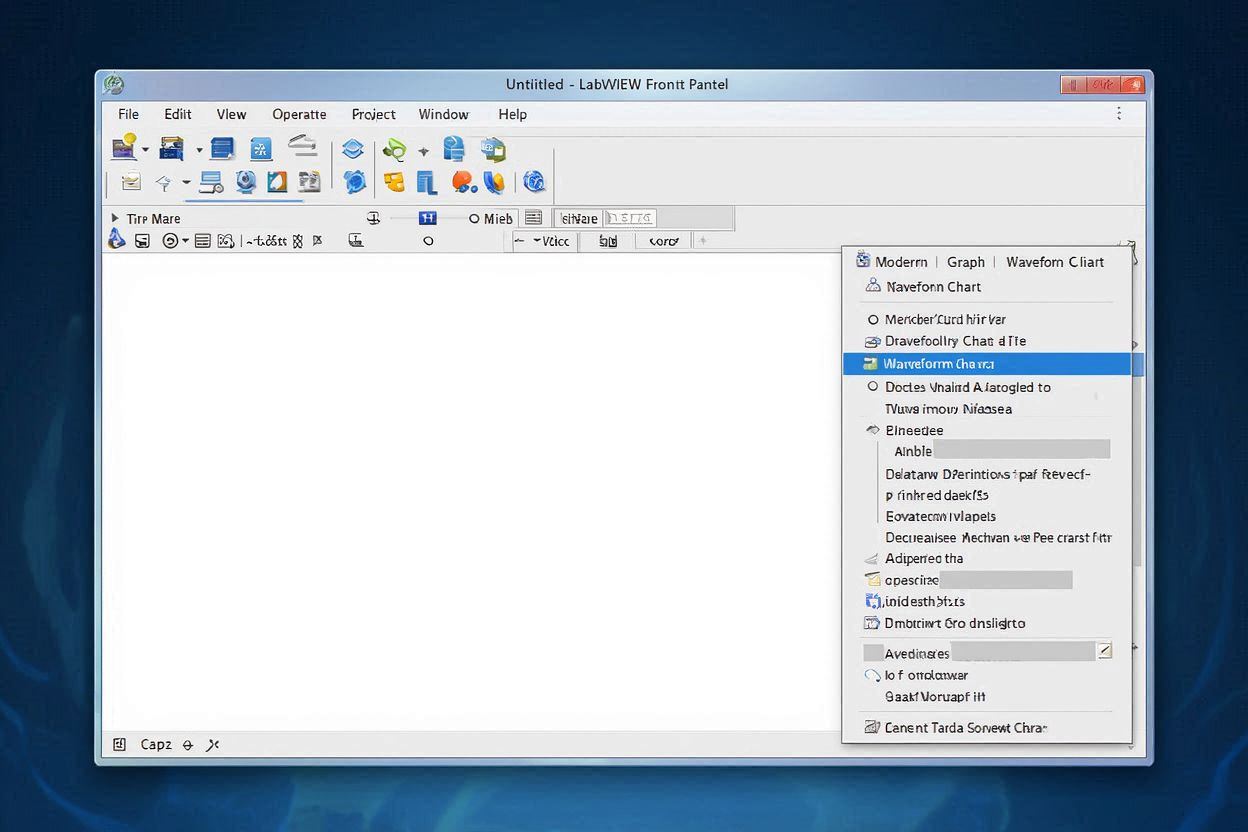
Start by creating a new VI (Virtual Instrument) in LabVIEW. On the Front Panel, right-click and navigate to Modern → Graph → Waveform Chart. Place the chart on the front panel.

  • Open LabVIEW and create a new VI
  • Right-click on the Front Panel
  • Navigate to Modern → Graph → Waveform Chart
  • Drag and drop the chart onto the front panel
2

Configure Chart Properties for Strip Chart Mode

Chart Properties Dialog - Strip Chart Configuration

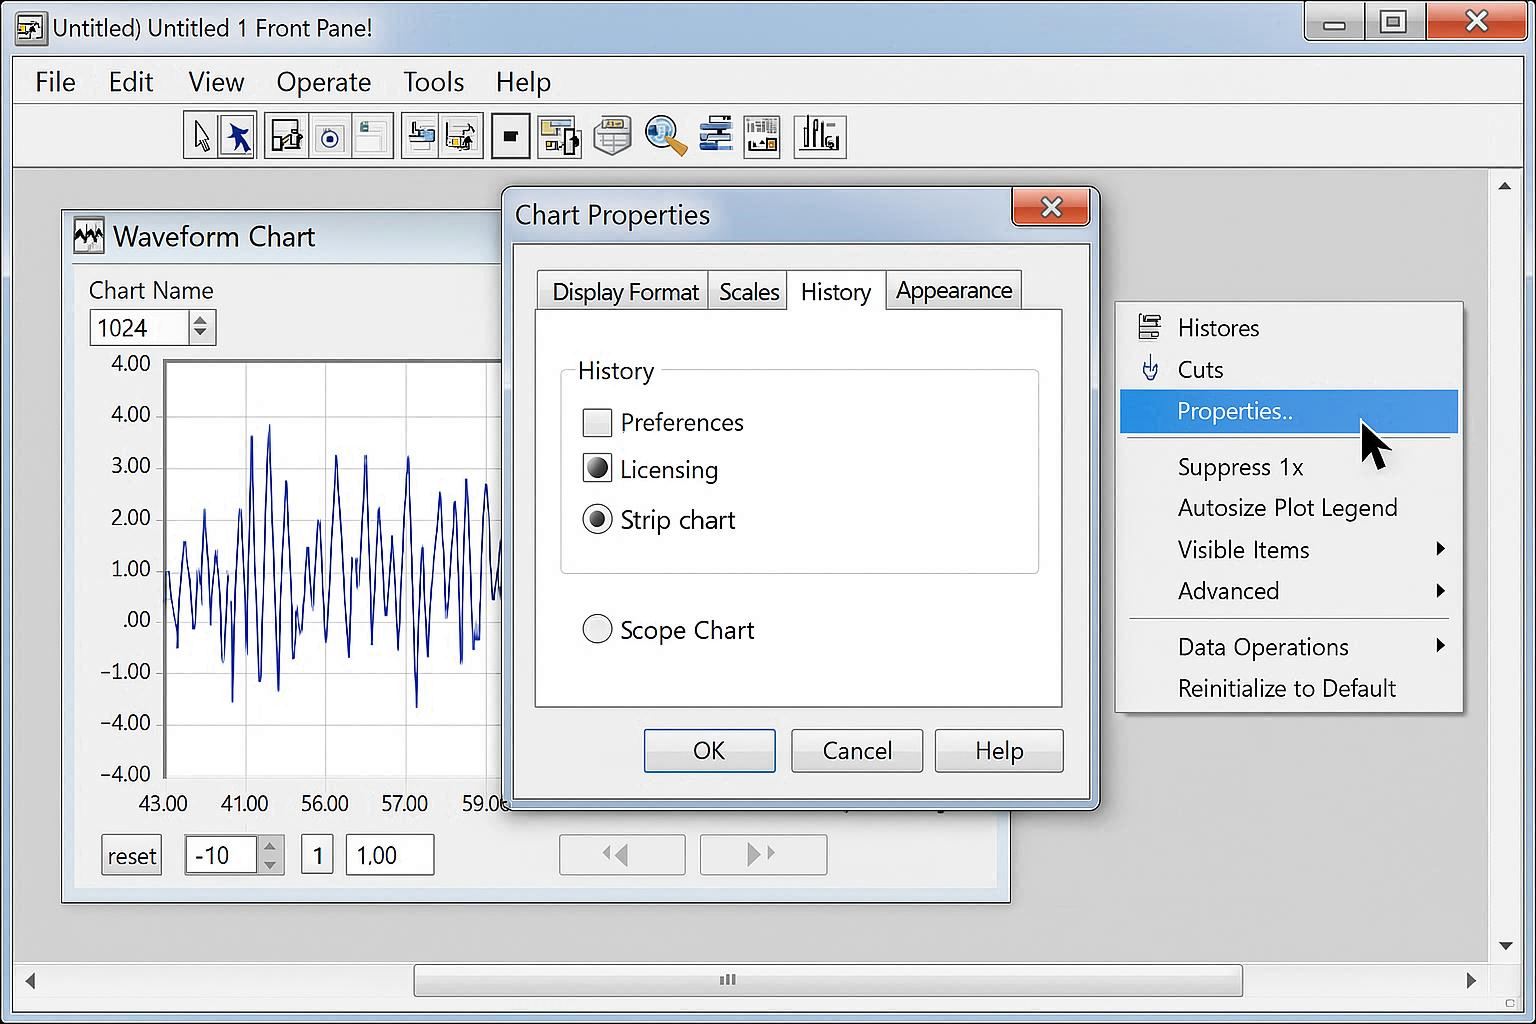
Right-click on the Waveform Chart and select Properties. In the Chart Properties dialog, configure the chart for strip chart mode.

  • Right-click on the Waveform Chart
  • Select "Properties" from the context menu
  • Go to the "Appearance" tab
  • Set "Chart Type" to "Strip Chart"
  • Configure "Update Mode" to "Continuous"
  • Set appropriate "Buffer Size" (e.g., 1000 points)
3

Create Data Acquisition Loop

LabVIEW Block Diagram - Data Acquisition Loop

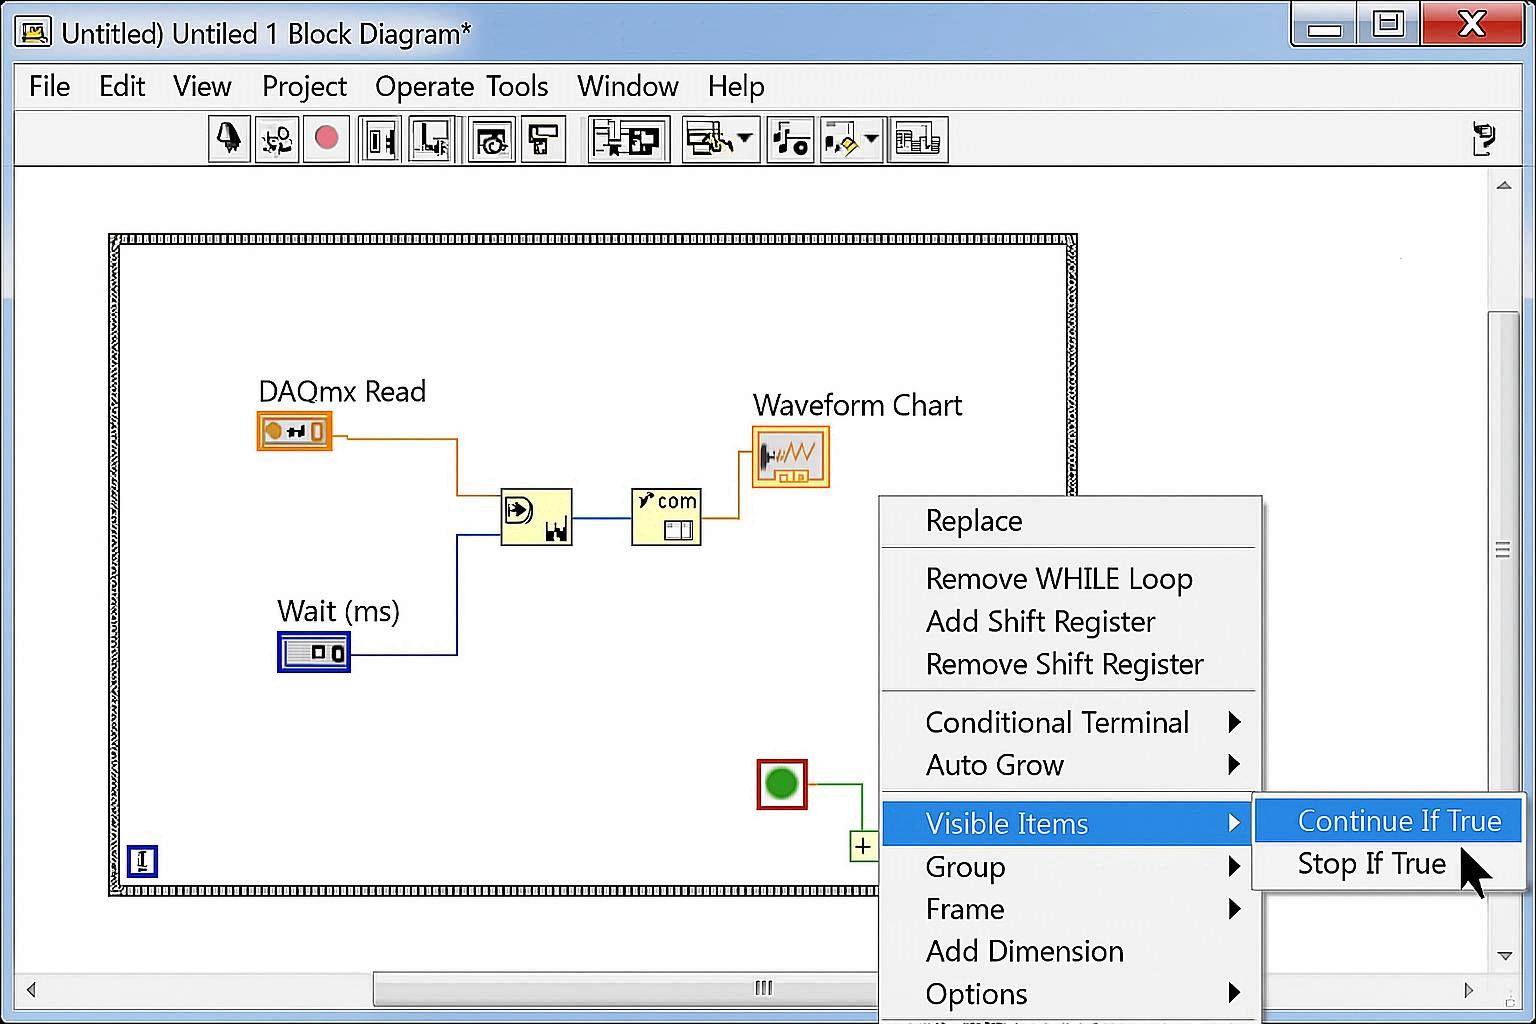
Switch to the Block Diagram and create a While Loop with data acquisition functions. Add timing control and data processing.

  • Switch to the Block Diagram (Ctrl+E)
  • Add a While Loop from Functions palette
  • Add data acquisition functions (e.g., DAQmx Read)
  • Connect the data output to the Waveform Chart
  • Add a Wait function for timing control
4

Add Data Processing and Analysis

Data Processing Functions in Block Diagram

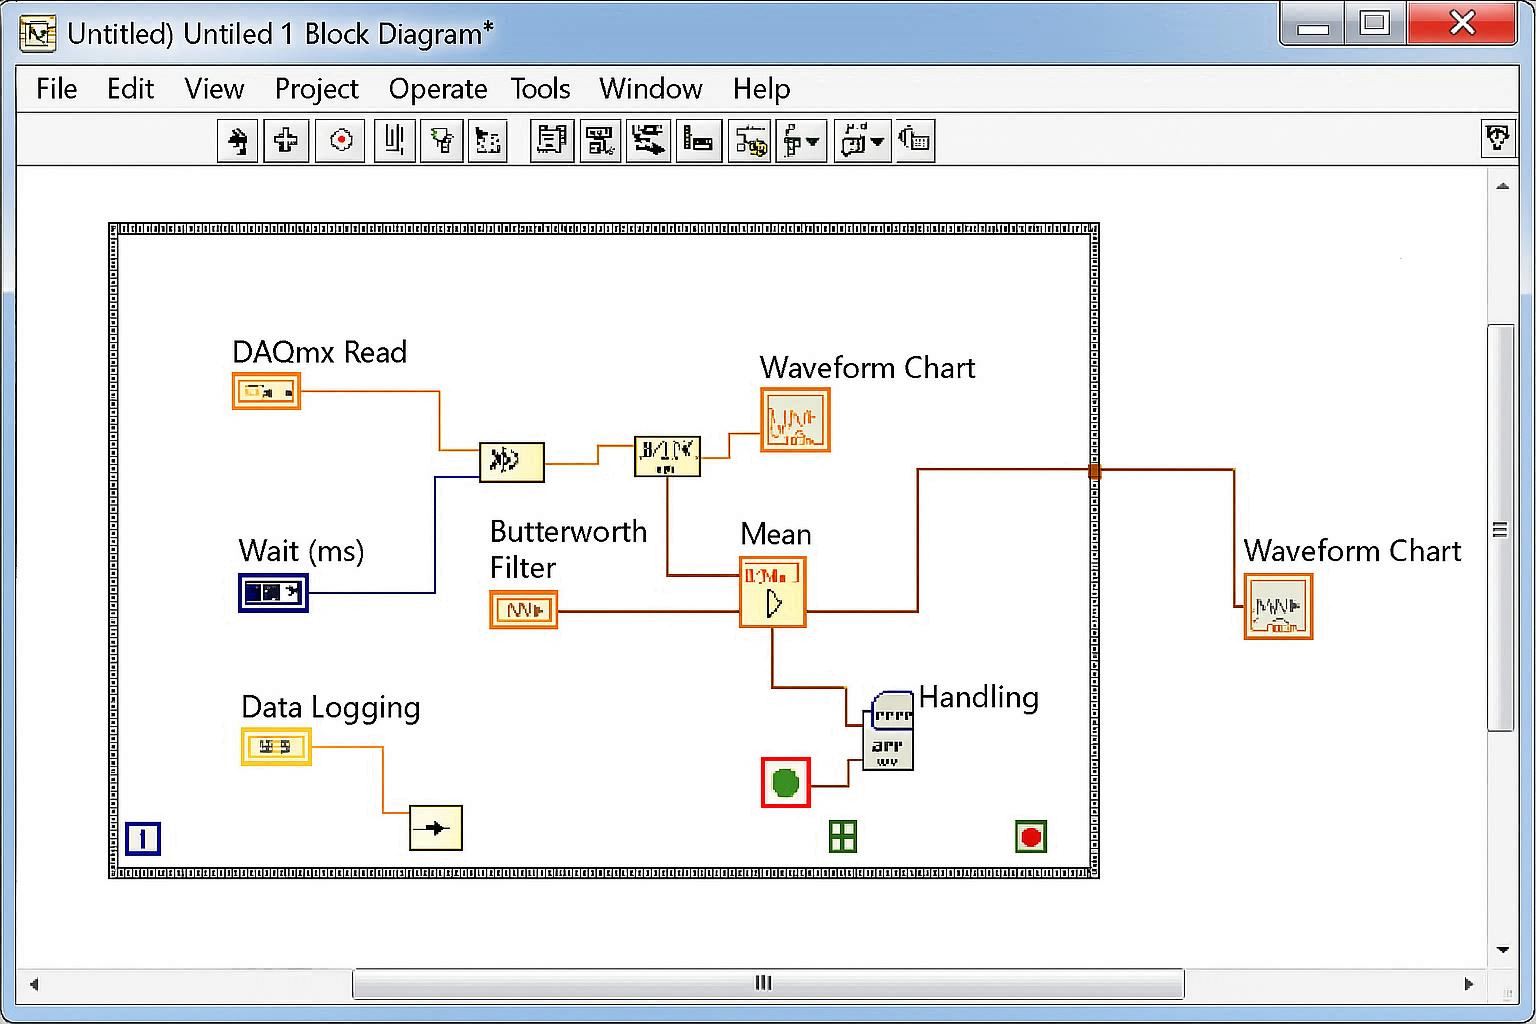
Enhance your strip chart with data processing, filtering, and analysis functions to provide meaningful insights from the acquired data.

  • Add filtering functions (e.g., Butterworth Filter)
  • Include statistical analysis (Mean, RMS, etc.)
  • Add alarm and threshold detection
  • Implement data validation and error handling
  • Add data logging capabilities
5

Customize Chart Appearance and Controls

Customized Strip Chart with Controls

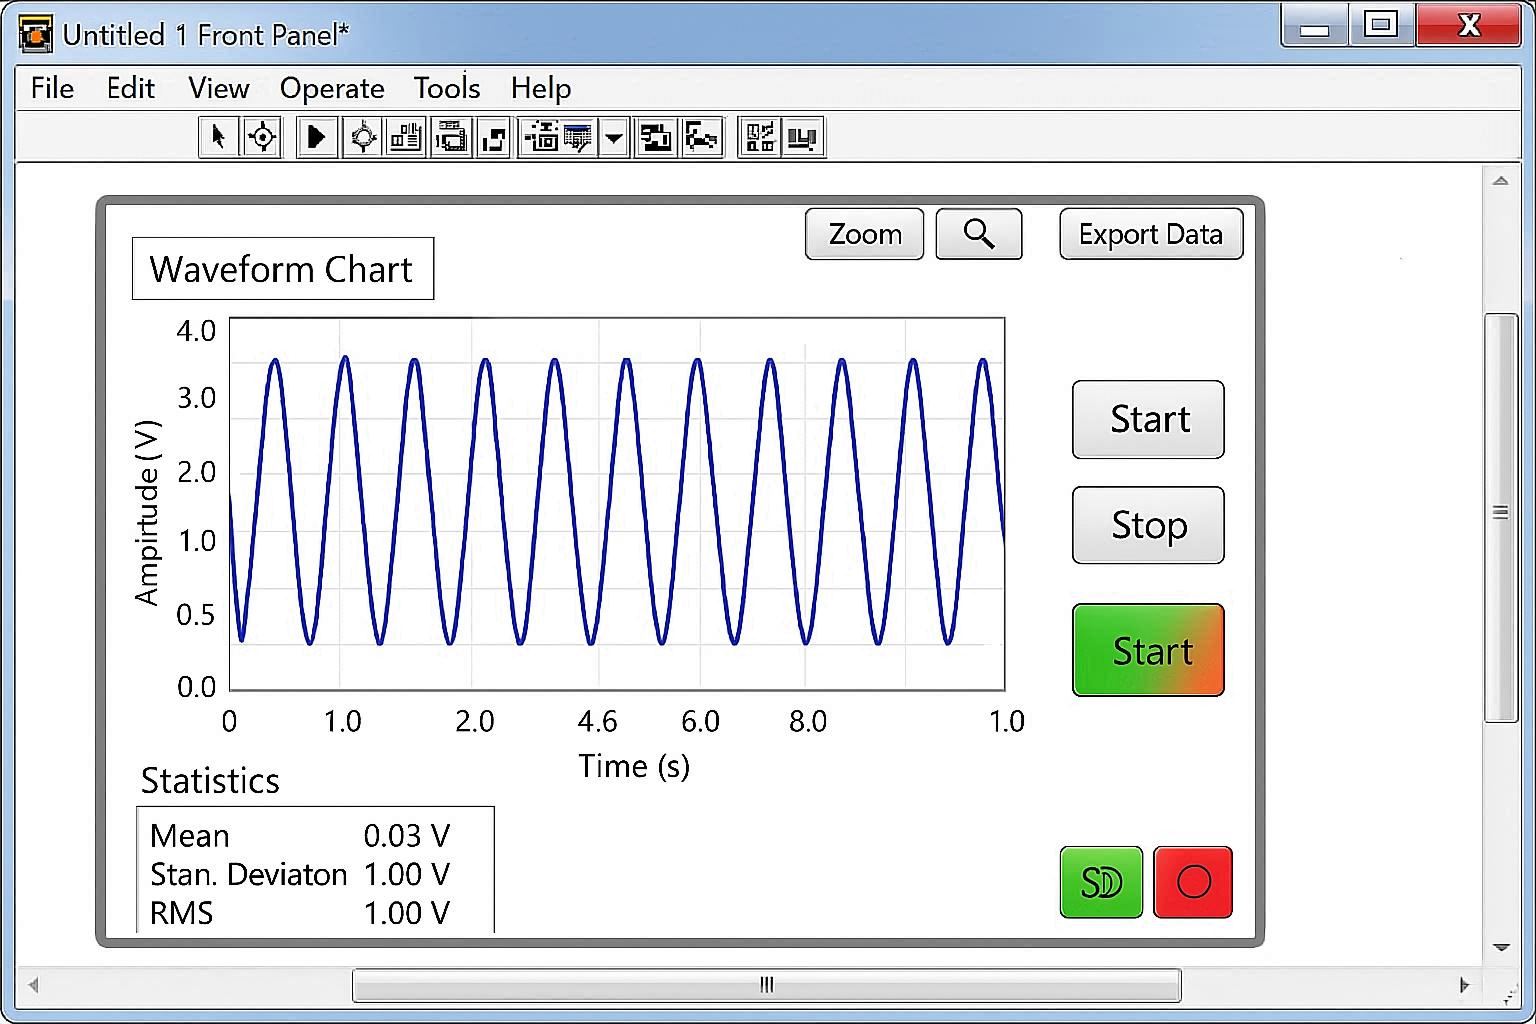
Customize the chart appearance, add controls for user interaction, and implement features like zoom, pan, and data export.

  • Customize chart colors and line styles
  • Add axis labels and titles
  • Implement zoom and pan functionality
  • Add start/stop controls
  • Include data export capabilities
  • Add real-time statistics display

LabVIEW Make Strip Chart Code Examples

Practical code examples and real-world applications for LabVIEW strip charts

Basic Strip Chart Implementation

// LabVIEW Block Diagram Code
// Basic Strip Chart with While Loop

// 1. Create While Loop
// 2. Add DAQmx Read function
// 3. Connect to Waveform Chart
// 4. Add Wait function (100ms)

// While Loop Structure:
// ┌─────────────┐
// │ DAQmx Read  │───┐
// └─────────────┘   │
//                   ▼
// ┌─────────────┐   ┌─────────────┐
// │ Wait (100ms)│   │ Waveform    │
// └─────────────┘   │ Chart       │
//                   └─────────────┘

// Key Properties:
// - Chart Type: Strip Chart
// - Update Mode: Continuous
// - Buffer Size: 1000 points
// - Time Scale: Auto

Explanation:

This basic implementation creates a simple strip chart that continuously acquires data and displays it in real-time. The While Loop ensures continuous operation, while the Wait function controls the sampling rate.

Multi-Channel Strip Chart

// Multi-Channel Strip Chart
// Supporting multiple data channels

// Channel Configuration:
// Channel 1: Temperature (AI0)
// Channel 2: Pressure (AI1)  
// Channel 3: Flow Rate (AI2)

// Data Structure:
// ┌─────────────────┐
// │ Multi-Channel   │
// │ DAQmx Read      │
// └─────────────────┘
//         │
//         ▼
// ┌─────────────────┐
// │ Bundle Data     │
// └─────────────────┘
//         │
//         ▼
// ┌─────────────────┐
// │ Waveform Chart  │
// │ (Multi-Plot)    │
// └─────────────────┘

// Chart Properties:
// - Multiple Y-axes
// - Different colors per channel
// - Independent scaling
// - Legend display

Explanation:

This example shows how to create a multi-channel strip chart that can display multiple data streams simultaneously. Each channel can have its own color, scaling, and display properties.

Advanced Strip Chart with Analysis

// Advanced Strip Chart with Real-time Analysis
// Including filtering, statistics, and alarms

// Data Flow:
// ┌─────────────┐    ┌─────────────┐    ┌─────────────┐
// │ DAQmx Read  │───▶│ Butterworth │───▶│ Statistics  │
// └─────────────┘    │ Filter      │    │ Analysis    │
//                    └─────────────┘    └─────────────┘
//                           │                  │
//                           ▼                  ▼
//                    ┌─────────────┐    ┌─────────────┐
//                    │ Waveform    │    │ Alarm       │
//                    │ Chart       │    │ Detection   │
//                    └─────────────┘    └─────────────┘

// Analysis Functions:
// - Moving Average Filter
// - RMS Calculation
// - Peak Detection
// - Threshold Monitoring
// - Data Logging

// Alarm Configuration:
// - High/Low Limits
// - Rate of Change
// - Statistical Anomalies

Explanation:

This advanced implementation includes real-time data analysis, filtering, and alarm detection. It demonstrates how to create a professional-grade strip chart suitable for industrial monitoring applications.

LabVIEW Strip Chart Applications

See how LabVIEW strip charts are used in actual industrial applications

Industrial Process Monitoring

Industrial Process Monitoring

LabVIEW strip charts are extensively used in manufacturing facilities to monitor critical process parameters such as temperature, pressure, flow rates, and vibration levels.

  • Real-time monitoring of production lines
  • Quality control parameter tracking
  • Equipment health monitoring
  • Alarm and alert systems

Laboratory Testing

Laboratory Testing and Research

Research laboratories use LabVIEW strip charts for data acquisition during experiments, providing real-time visualization of test results and experimental data.

  • Scientific data acquisition
  • Experimental parameter monitoring
  • Research data visualization
  • Publication-quality graphics

Power Generation

Power Generation and Distribution

Power plants and electrical utilities use LabVIEW strip charts to monitor electrical parameters, grid stability, and equipment performance in real-time.

  • Electrical parameter monitoring
  • Grid stability analysis
  • Equipment performance tracking
  • Predictive maintenance