Introduction
Strip charts are powerful data visualization tools that display continuous data streams in real-time, making them essential for monitoring, analysis, and research applications. When combined with RStudio, one of the most popular integrated development environments (IDE) for R programming, creating professional strip charts becomes both intuitive and efficient.
This comprehensive tutorial will guide you through everything you need to know about creating strip charts in RStudio, from understanding what RStudio is to implementing advanced strip chart visualizations with detailed code examples.
What is RStudio?
RStudio is a powerful, open-source integrated development environment (IDE) specifically designed for R programming. It provides a user-friendly interface that makes R programming more accessible and efficient, even for beginners. RStudio enhances the R experience by offering features like syntax highlighting, code completion, integrated help, and powerful debugging tools.
Download RStudio: You can download RStudio Desktop for free from the official Posit website at https://posit.co/download/rstudio-desktop/. RStudio is available for Windows, macOS, and Linux operating systems.
Key Features of RStudio
- Integrated Console: Execute R code directly within the IDE
- Script Editor: Write and edit R scripts with syntax highlighting
- Environment Pane: View and manage variables, data frames, and objects
- File Browser: Navigate and manage project files
- Package Manager: Easily install and manage R packages
- Plot Viewer: Display and export visualizations
- Help Documentation: Access R documentation and package help files
The Relationship Between RStudio, R, and Strip Charts
Understanding the relationship between these three components is crucial for effective data visualization:
| Component | Role | Purpose |
|---|---|---|
| R | Programming Language | Provides the statistical computing foundation and functions for data analysis and visualization |
| RStudio | Development Environment | Offers an intuitive interface to write, test, and execute R code more efficiently |
| Strip Chart | Visualization Type | A specific type of chart created using R packages (like ggplot2, plotly) to display continuous data streams |
In essence, R is the programming language that provides the capabilities, RStudio is the tool that makes working with R easier, and Strip Charts are the visualizations you create using R's plotting capabilities within RStudio.
Why Use RStudio for Strip Charts?
- Package Management: Easily install and load visualization packages like ggplot2, plotly, and lattice
- Interactive Development: Test code snippets in the console before adding to scripts
- Visual Feedback: View plots immediately in the Plot pane
- Code Organization: Manage multiple scripts and functions efficiently
- Documentation: Access help files and examples for visualization functions
RStudio Interface Overview
The RStudio interface consists of four main panes, each serving a specific purpose in your data analysis workflow:
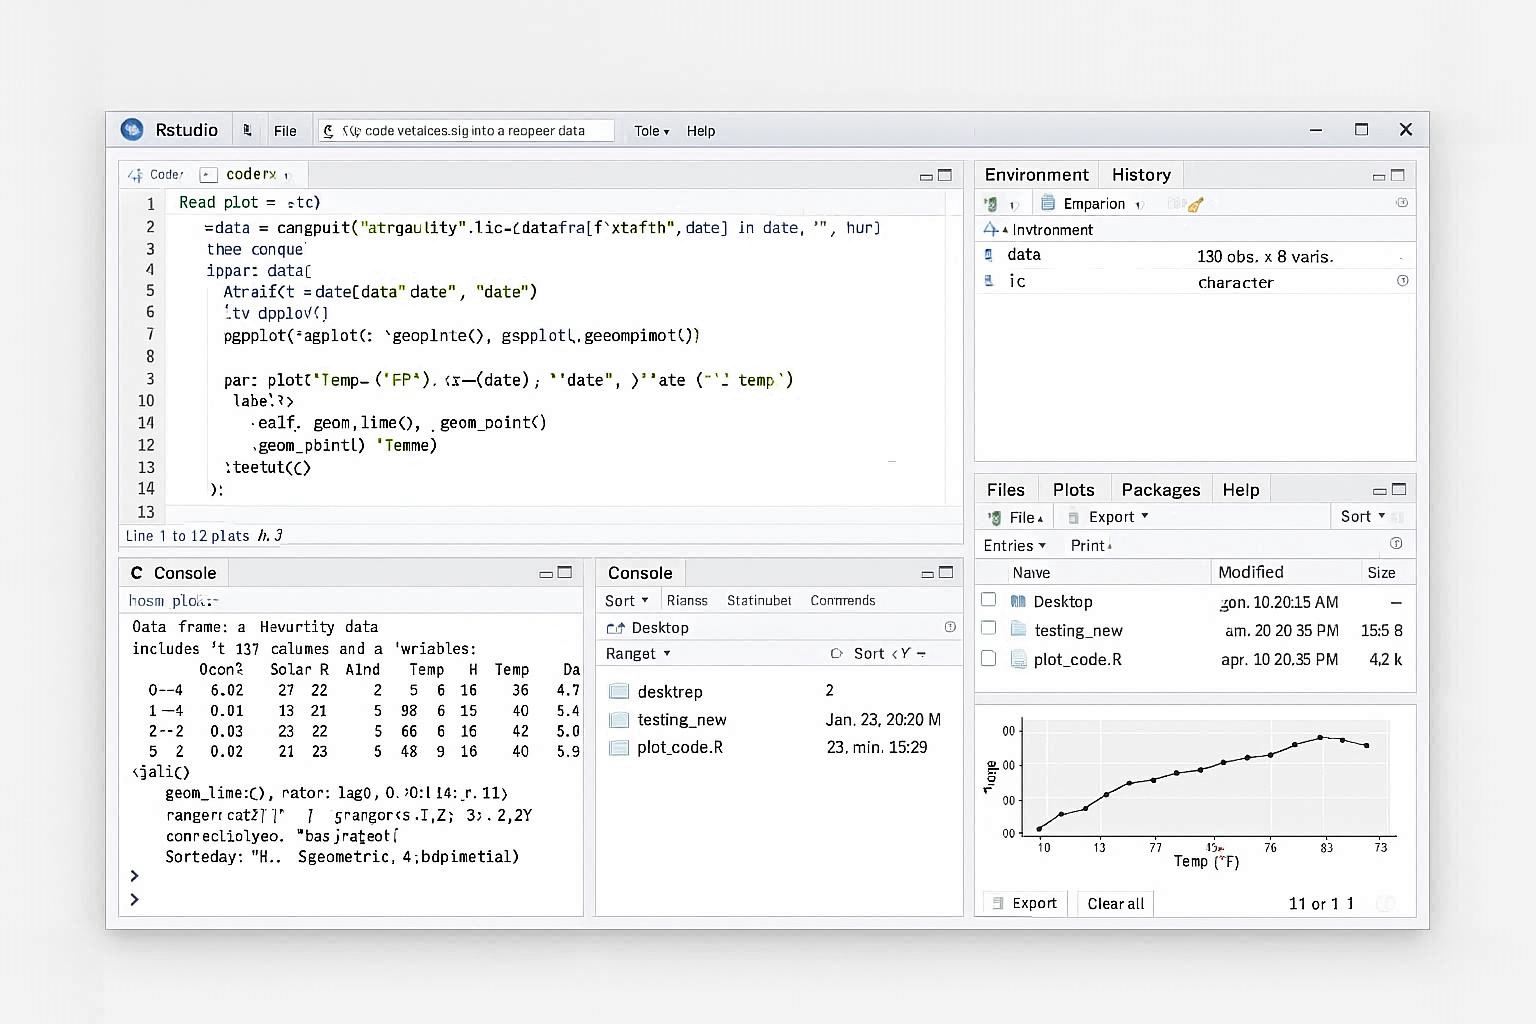
Figure 1: RStudio Interface with Four Main Panels
1. Source Pane (Top Left)
The Source pane is where you write and edit your R scripts. This is your primary workspace for creating code that will generate strip charts. Features include:
- Syntax highlighting for better code readability
- Code completion suggestions
- Line numbers for easy reference
- Multiple tabs for working with several scripts simultaneously
2. Console Pane (Bottom Left)
The Console pane is where R code is executed. You can type commands directly here or run code from your scripts. This pane shows:
- Command output and results
- Error messages and warnings
- Interactive R prompt (>)
- Execution history
3. Environment/History Pane (Top Right)
This pane has multiple tabs:
- Environment: Displays all active variables, data frames, and objects in your current R session
- History: Shows a list of all commands you've executed
- Connections: Manages database and other external connections
4. Files/Plots/Packages/Help Pane (Bottom Right)
This multi-tab pane provides:
- Files: Browse and manage project files and directories
- Plots: Display generated visualizations, including your strip charts
- Packages: View installed packages and install new ones
- Help: Access R documentation and function help files
- Viewer: Display HTML widgets and interactive plots
Creating Your First RStudio Project
Organizing your work in RStudio projects helps maintain clean, manageable code and data. Follow these steps to create a new project for your strip chart work:
Launch RStudio Desktop on your computer. You'll see the default RStudio interface with four panes.
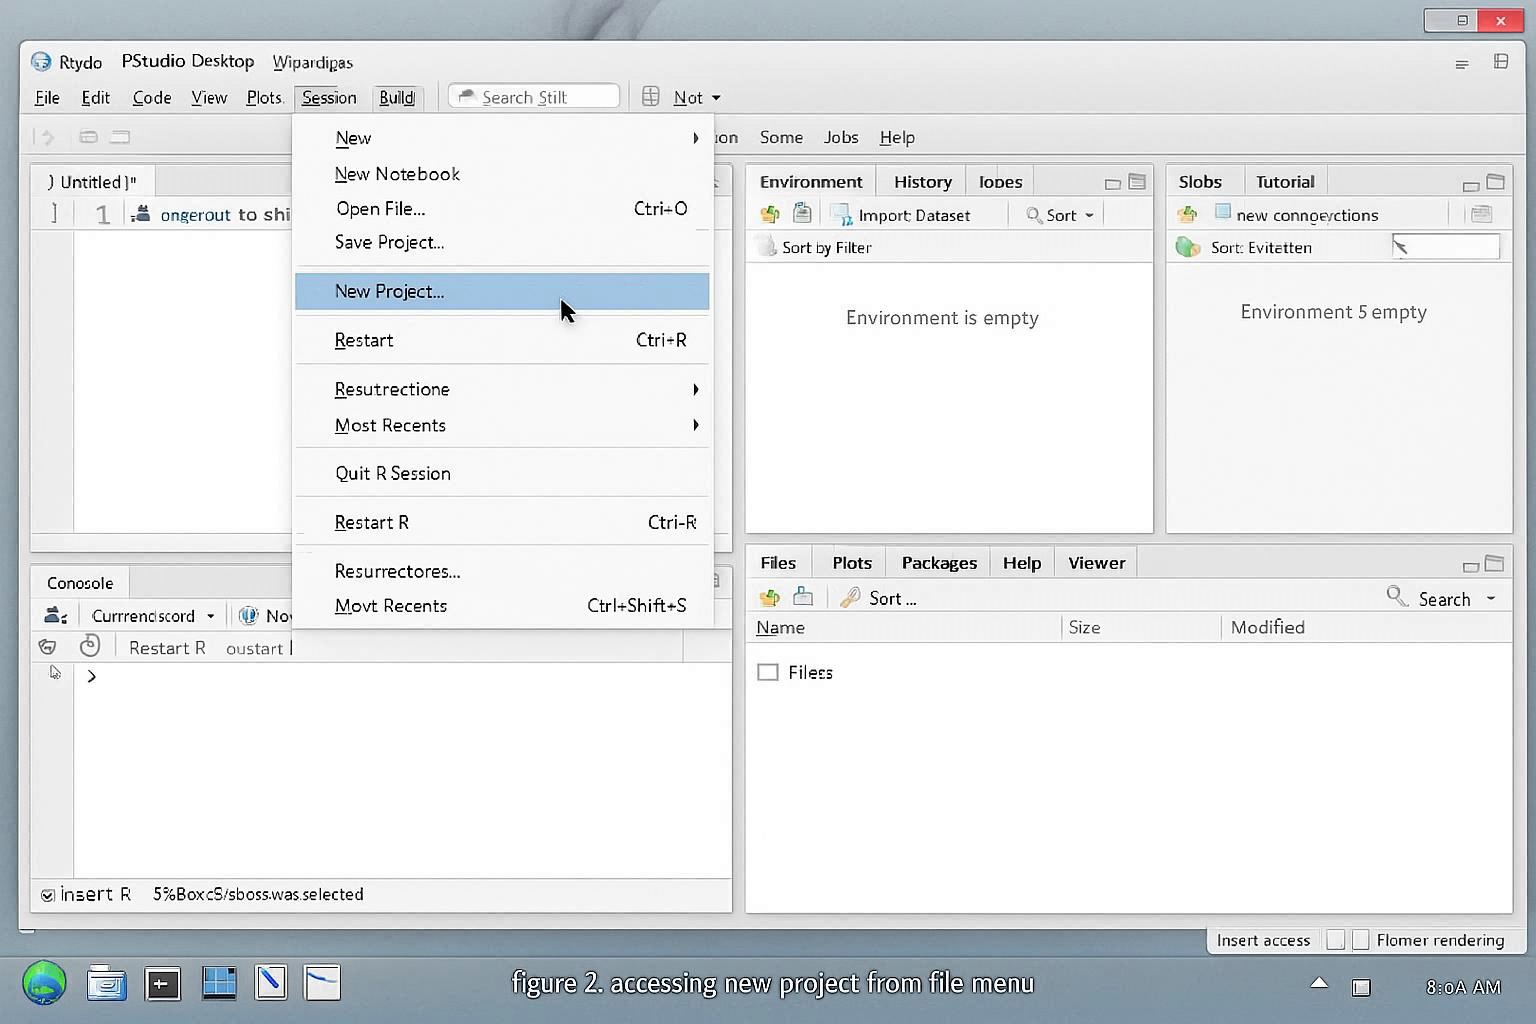
Figure 2: Accessing New Project from File Menu
Click on File → New Project in the menu bar, or use the project dropdown in the top-right corner and select "New Project...".
Select "New Directory" to create a project in a new folder, then choose "New Project".
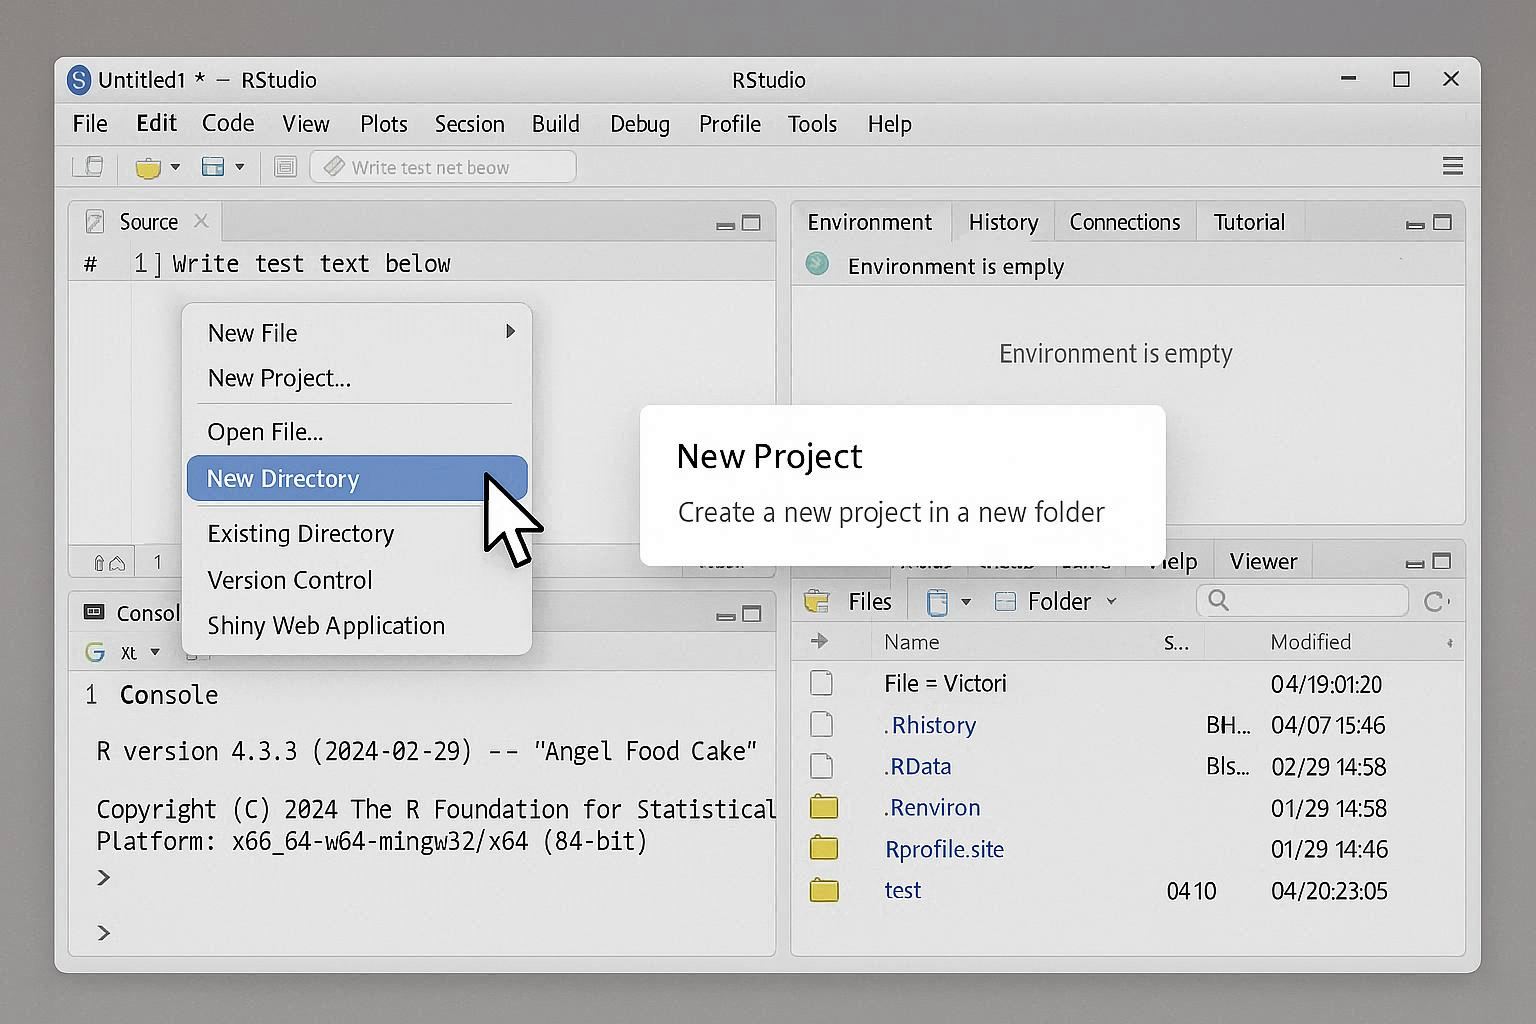
Figure 3: Selecting Project Type
Enter a descriptive name for your project, such as "StripChart_Analysis" or "Data_Visualization". Choose a directory location where you want to save the project.
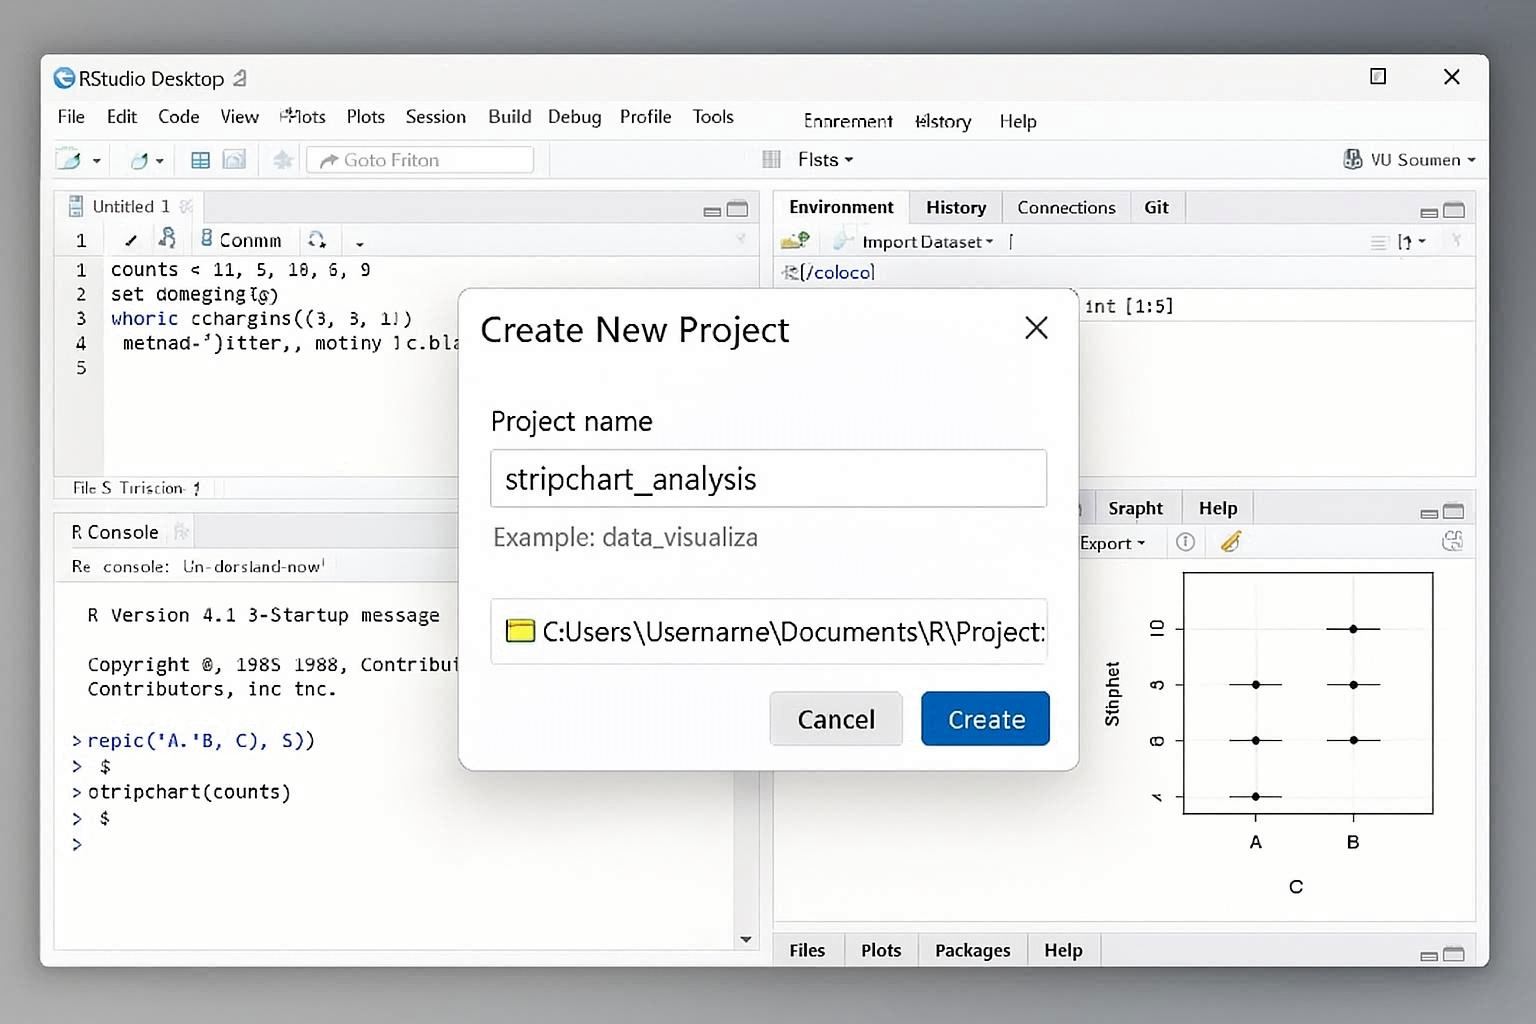
Figure 4: Naming Your RStudio Project
Click the "Create Project" button. RStudio will create a new project directory with a .Rproj file.
Project Benefits: RStudio projects automatically set your working directory, preserve your workspace, and allow you to easily switch between different projects. The .Rproj file stores project settings and can be double-clicked to open the project directly.
Creating Strip Charts in RStudio: Complete Tutorial
Now that you understand RStudio and have set up your project, let's create professional strip charts. We'll cover multiple methods using different R packages, each suited for different use cases.
Method 1: Basic Strip Chart Using Base R
Let's start with a simple strip chart using R's built-in functions. This is perfect for quick visualizations and understanding the fundamentals.
Step 1: Prepare Your Data
First, let's create sample data for our strip chart. In the RStudio Console or a new script, enter:
# Generate sample time series data
set.seed(123)
time_points <- seq(1, 100, by = 1)
temperature <- 20 + cumsum(rnorm(100, mean = 0, sd = 0.5)) +
               sin(time_points * 0.1) * 2

# Create a data frame
data <- data.frame(
    Time = time_points,
    Temperature = temperature
)

# View the first few rows
head(data)
Step 2: Create Basic Strip Chart
Now, let's create a simple strip chart visualization:
# Create a basic strip chart
plot(data$Time, data$Temperature,
     type = "l",           # Line type
     col = "steelblue",    # Line color
     lwd = 2,              # Line width
     xlab = "Time (minutes)",
     ylab = "Temperature (°C)",
     main = "Temperature Strip Chart",
     ylim = c(15, 25))     # Set y-axis limits

# Add grid for better readability
grid(col = "gray90", lty = "dotted")

# Add horizontal reference line
abline(h = 20, col = "red", lty = 2, lwd = 1)
Figure 5: Basic Strip Chart Created in RStudio
Method 2: Advanced Strip Chart Using ggplot2
For more professional and customizable strip charts, ggplot2 is the industry standard. Let's create an advanced visualization.
Step 1: Install and Load Required Packages
First, install ggplot2 if you haven't already. In RStudio, you can use the Packages pane or run this command:
# Install ggplot2 if not already installed
if (!require(ggplot2)) {
    install.packages("ggplot2")
}

# Load the library
library(ggplot2)
Step 2: Create Enhanced Data with Multiple Variables
Let's create a more complex dataset with multiple measurement variables:
# Create comprehensive time series data
set.seed(456)
n_points <- 200
time_series <- seq(1, n_points, by = 0.5)

# Generate multiple variables
data_advanced <- data.frame(
    Time = time_series,
    Temperature = 22 + cumsum(rnorm(length(time_series), 0, 0.3)) +
                  sin(time_series * 0.05) * 1.5,
    Pressure = 1013 + cumsum(rnorm(length(time_series), 0, 0.2)) +
               cos(time_series * 0.08) * 2,
    Humidity = 50 + cumsum(rnorm(length(time_series), 0, 0.15)) +
               sin(time_series * 0.03) * 5
)

# View data structure
str(data_advanced)
summary(data_advanced)
Step 3: Create Multi-Panel Strip Chart
Create a professional multi-panel strip chart showing all variables:
# Reshape data for ggplot2 (long format)
library(tidyr)
data_long <- pivot_longer(data_advanced,
                          cols = c(Temperature, Pressure, Humidity),
                          names_to = "Variable",
                          values_to = "Value")

# Create multi-panel strip chart
strip_chart <- ggplot(data_long, aes(x = Time, y = Value)) +
    geom_line(aes(color = Variable), size = 0.8) +
    facet_wrap(~ Variable, ncol = 1, scales = "free_y") +
    labs(
        title = "Multi-Variable Strip Chart",
        subtitle = "Real-time Monitoring of Environmental Parameters",
        x = "Time (minutes)",
        y = "Value",
        color = "Parameter"
    ) +
    theme_minimal() +
    theme(
        plot.title = element_text(size = 16, face = "bold", hjust = 0.5),
        plot.subtitle = element_text(size = 12, hjust = 0.5),
        axis.text = element_text(size = 10),
        axis.title = element_text(size = 12, face = "bold"),
        strip.text = element_text(size = 11, face = "bold"),
        legend.position = "none",
        panel.grid.minor = element_blank(),
        panel.grid.major = element_line(color = "gray90")
    ) +
    scale_color_manual(values = c("Temperature" = "#e74c3c",
                                  "Pressure" = "#3498db",
                                  "Humidity" = "#2ecc71"))

# Display the chart
print(strip_chart)
Figure 6: Multi-Panel Strip Chart Created with ggplot2
Step 4: Add Real-time Animation (Optional)
For dynamic strip charts that update in real-time, you can use the plotly package:
# Install and load plotly for interactive charts
if (!require(plotly)) {
    install.packages("plotly")
}
library(plotly)

# Create interactive strip chart
interactive_chart <- ggplot(data_advanced, aes(x = Time, y = Temperature)) +
    geom_line(color = "#e74c3c", size = 1) +
    geom_point(color = "#c0392b", size = 0.5, alpha = 0.6) +
    labs(
        title = "Interactive Temperature Strip Chart",
        x = "Time (minutes)",
        y = "Temperature (°C)"
    ) +
    theme_minimal()

# Convert to interactive plotly chart
interactive_plot <- ggplotly(interactive_chart)
interactive_plot
Method 3: Real-time Strip Chart with Data Streaming
For applications requiring real-time data updates, here's how to create a streaming strip chart:
# Function to create real-time strip chart
create_realtime_strip_chart <- function(data, window_size = 50) {
    # Keep only the last 'window_size' points for scrolling effect
    if (nrow(data) > window_size) {
        data <- tail(data, window_size)
    }

    # Create the chart
    p <- ggplot(data, aes(x = Time, y = Temperature)) +
        geom_line(color = "#2563eb", size = 1.2) +
        geom_area(fill = "#2563eb", alpha = 0.2) +
        labs(
            title = "Real-time Temperature Strip Chart",
            x = "Time",
            y = "Temperature (°C)"
        ) +
        theme_minimal() +
        theme(
            plot.title = element_text(size = 14, face = "bold"),
            panel.background = element_rect(fill = "#f8fafc"),
            panel.grid.major = element_line(color = "white"),
            panel.grid.minor = element_blank()
        )

    return(p)
}

# Example: Simulate real-time data updates
current_data <- data.frame(Time = 1:10, Temperature = rnorm(10, 20, 1))
chart <- create_realtime_strip_chart(current_data)
print(chart)
Best Practices for Strip Charts in RStudio
- Choose Appropriate Time Windows: Display only relevant time ranges to avoid cluttered visualizations
- Use Consistent Colors: Maintain color schemes across related charts for easy comparison
- Add Reference Lines: Include threshold lines to highlight critical values
- Optimize Performance: For large datasets, consider data aggregation or sampling
- Export High Quality: Use ggsave() for publication-quality outputs
# Save your strip chart as high-resolution image
ggsave("strip_chart.png",
       plot = strip_chart,
       width = 10,
       height = 8,
       dpi = 300,
       units = "in")
Conclusion
RStudio provides an excellent environment for creating professional strip charts. By combining R's powerful statistical capabilities with RStudio's intuitive interface, you can create everything from simple line charts to complex, multi-panel real-time visualizations.
Whether you're monitoring industrial processes, analyzing scientific data, or visualizing business metrics, strip charts in RStudio offer the flexibility and power you need. Start with the basic examples provided in this tutorial, then customize them to fit your specific requirements.
Next Steps: Explore additional R packages like shiny for interactive dashboards, dygraphs for time series visualization, and plotly for web-based interactive charts. Practice with your own data and experiment with different styling options to create publication-ready visualizations.